Topzle Topzle

Comparison of United States incarceration rate with other countries

Updated: Wikipedia source

Comparison of United States incarceration rate with other countries

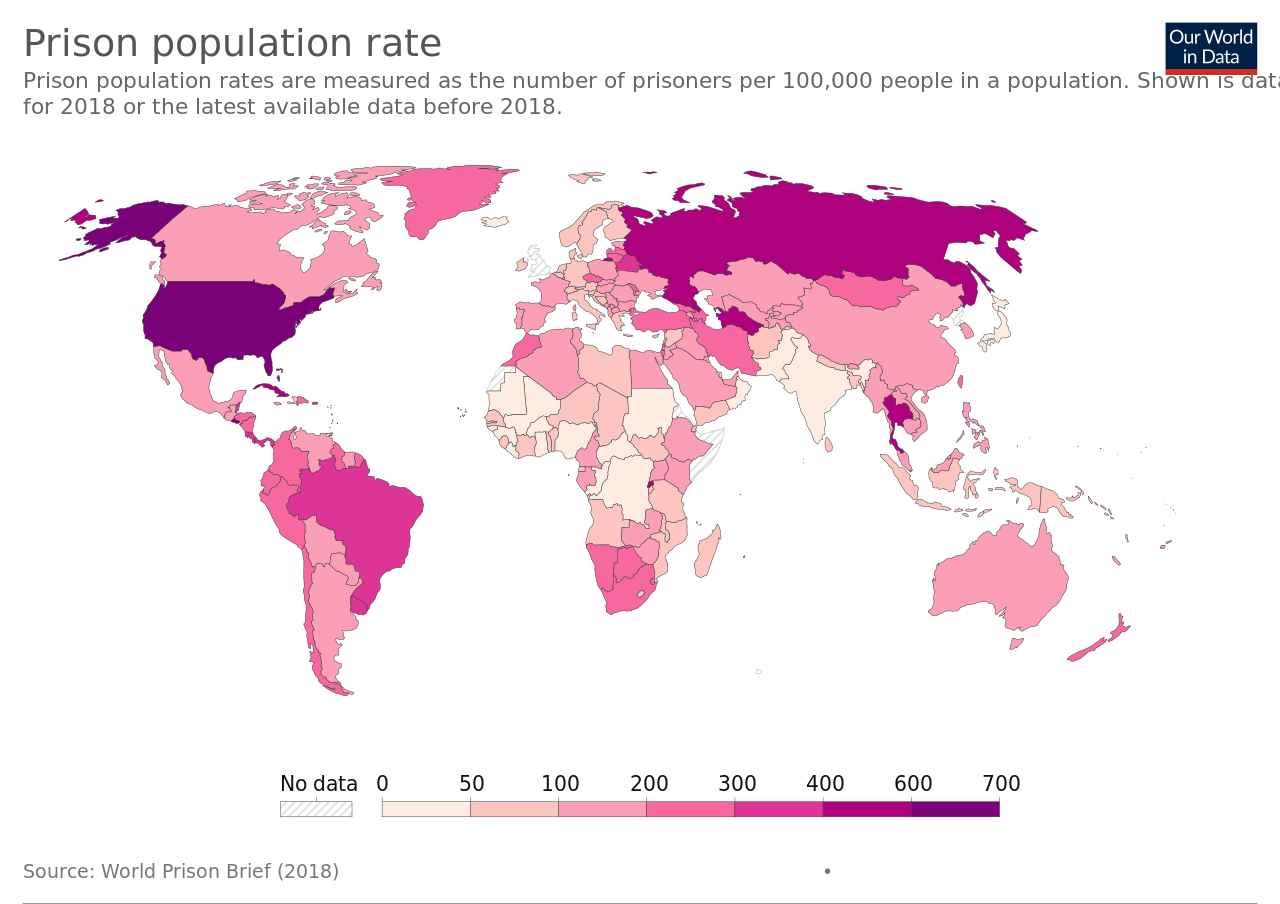
In 2022, the United States had 1,808,100 inmates in adult facilities (prisons and jails), at a rate of 541 per 100,000 population. That was the 5th highest rate in the world. In 2021, the United States had 1,767,200 inmates in adult facilities (prisons and jails). This left America with the highest prison population if China's latest official number (2018) of 1,690,000 (sentenced prisoners only) were used. According to the World Prison Brief the total number in China would be much higher if pre-trial detainees and those held in administrative detention were added, and yet more depending on the number of Uyghurs being held. The 2021 US incarceration rate of 531 per 100,000 population was the 6th highest rate. According to the World Prison Population List (11th edition) there were around 10.35 million people in penal institutions worldwide in 2015. The US had 2,173,800 prisoners in adult facilities in 2015. That means the US held 21.0% of the world's prisoners in 2015, even though the US represented only around 4.4 percent of the world's population in 2015. In 2015 the US had the 2nd highest incarceration rate (698), behind the Seychelles rate of 799 per 100,000. Comparing English-speaking developed countries; the incarceration rate of Canada was 85 per 100,000 (as of 2020), England and Wales was 146 per 100,000 (as of 2023), and Australia was 158 per 100,000 (as of 2022). Comparing other developed countries, the rate of Spain was 113 per 100,000 (as of 2023), France was 109 per 100,000 (as of 2023), Germany was 67 per 100,000 (as of 2022), Norway was 53 per 100,000 (as of 2023), Netherlands was 65 per 100,000 (as of 2022), Japan was 36 per 100,000 (as of 2021), Sweden was 82 per 100,000 (as of 2023), and Italy was 99 per 100,000 (as of 2023), Comparing other countries with harsh sentencing for illegal drugs, Saudi Arabia was 207 per 100,000 (as of 2017), Russia was 300 per 100,000 (as of 2023), Kazakhstan was 184 per 100,000 (as of 2022), and Singapore was 156 per 100,000 (as of 2022). The incarceration rate of the People's Republic of China varies depending on sources and measures. According to the World Prison Brief, the rate for only sentenced prisoners was 119 per 100,000 (as of 2017). It would be much higher if pre-trial detainees, those held in administrative detention, and Uyghurs being held were included.

Tables

US incarceration count, and rate per 100,000 population. Jails, state prisons, federal prisons.[3]
1940
1940
Year
1940
Count
264,834
Rate
201
1950
1950
Year
1950
Count
264,620
Rate
176
1960
1960
Year
1960
Count
346,015
Rate
193
1970
1970
Year
1970
Count
328,020
Rate
161
1980
1980
Year
1980
Count
503,586
Rate
220
1985
1985
Year
1985
Count
744,208
Rate
311
1990
1990
Year
1990
Count
1,148,702
Rate
457
1995
1995
Year
1995
Count
1,585,586
Rate
592
2000
2000
Year
2000
Count
1,937,482
Rate
683
2002
2002
Year
2002
Count
2,033,022
Rate
703
2004
2004
Year
2004
Count
2,135,335
Rate
725
2006
2006
Year
2006
Count
2,258,792
Rate
752
2008
2008
Year
2008
Count
2,307,504
Rate
755
2010
2010
Year
2010
Count
2,270,142
Rate
731
2012
2012
Year
2012
Count
2,228,424
Rate
707
2014
2014
Year
2014
Count
2,217,947
Rate
693
2016
2016
Year
2016
Count
2,157,800
Rate
666
2018
2018
Year
2018
Count
2,102,400
Rate
642
2020
2020
Year
2020
Count
1,675,400
Rate
505
2021
2021
Year
2021
Count
1,767,200
Rate
531
2022
2022
Year
2022
Count
1,808,100
Rate
541
Year
Count
Rate
1940
264,834
201
1950
264,620
176
1960
346,015
193
1970
328,020
161
1980
503,586
220
1985
744,208
311
1990
1,148,702
457
1995
1,585,586
592
2000
1,937,482
683
2002
2,033,022
703
2004
2,135,335
725
2006
2,258,792
752
2008
2,307,504
755
2010
2,270,142
731
2012
2,228,424
707
2014
2,217,947
693
2016
2,157,800
666
2018
2,102,400
642
2020
1,675,400
505
2021
1,767,200
531
2022
1,808,100
541

References

  1. Highest to Lowest. World Prison Brief (WPB). Use dropdown menu to choose lists of countries by region, or the whole worl
    http://www.prisonstudies.org/highest-to-lowest
  2. Jacob Kang-Brown, Chase Montagnet, and Jasmine Heiss. People in Jail and Prison in Spring 2021. New York: Vera Institute
    https://www.vera.org/publications/people-in-jail-and-prison-in-spring-2021
  3. United States of America. World Prison Brief.
    https://www.prisonstudies.org/country/united-states-america
  4. China Archived 2019-09-24 at the Wayback Machine. World Prison Brief.
    http://www.prisonstudies.org/country/china
  5. Walmsley, Roy (2 Feb 2016). World Prison Population List (11th edition) (PDF). From the Research & Publications page of
    http://www.prisonstudies.org/sites/default/files/resources/downloads/world_prison_population_list_11th_edition_0.pdf
  6. Correctional Populations in the United States, 2015. By Danielle Kaeble and Lauren Glaze, BJS Statisticians. Dec. 2016.
    https://www.bjs.gov/index.cfm?ty=pbdetail&iid=5870
  7. US Population by Month. US resident population. Source: US Census Bureau.
    https://www.multpl.com/united-states-population/table/by-month
  8. The World Population Prospects: 2015 Revision. 29 July 2015 article. From United Nations Department of Economic and Soci
    http://www.un.org/en/development/desa/publications/world-population-prospects-2015-revision.html
  9. Canada. World Prison Brief.
    http://www.prisonstudies.org/country/canada
  10. United Kingdom: England & Wales. World Prison Brief.
    http://www.prisonstudies.org/country/united-kingdom-england-wales
  11. Australia. World Prison Brief.
    http://www.prisonstudies.org/country/australia
  12. Spain. World Prison Brief.
    http://www.prisonstudies.org/country/spain
  13. France. World Prison Brief.
    http://www.prisonstudies.org/country/france
  14. Germany. World Prison Brief.
    http://www.prisonstudies.org/country/germany
  15. Norway. World Prison Brief.
    http://www.prisonstudies.org/country/norway
  16. Netherlands. World Prison Brief.
    http://www.prisonstudies.org/country/netherlands
  17. Japan. World Prison Brief.
    http://www.prisonstudies.org/country/japan
  18. Sweden. World Prison Brief.
    http://www.prisonstudies.org/country/sweden
  19. Italy. World Prison Brief.
    http://www.prisonstudies.org/country/Italy
  20. Saudi Arabia. World Prison Brief.
    http://www.prisonstudies.org/country/saudi-arabia
  21. Russia. World Prison Brief.
    http://www.prisonstudies.org/country/russian-federation
  22. Kazakhstan. World Prison Brief.
    http://www.prisonstudies.org/country/kazakhstan
  23. Singapore. World Prison Brief.
    http://www.prisonstudies.org/country/singapore
  24. One in 100: Behind Bars in America 2008. February 28, 2008. The Pew Center on the States.
    http://www.pewtrusts.org/en/research-and-analysis/reports/2008/02/28/one-in-100-behind-bars-in-america-2008
  25. Liptak, Adam (28 Feb 2008). 1 in 100 U.S. Adults Behind Bars, New Study Says. The New York Times.
    https://www.nytimes.com/2008/02/28/us/28cnd-prison.html
  26. Correctional Populations in the United States, 2013 (NCJ 248479). Published December 2014 by U.S. Bureau of Justice Stat
    https://www.bjs.gov/index.cfm?ty=pbdetail&iid=5177
  27. Prisoners in 2008 Archived 2011-07-16 at the Wayback Machine. (NCJ 228417). December 2009 report from the U.S. Bureau of
    https://bjs.ojp.usdoj.gov/index.cfm?ty=pbdetail&iid=1763
  28. Sickmund, M., Sladky, T.J., Kang, W., & Puzzanchera, C.. "Easy Access to the Census of Juveniles in Residential Placemen
    https://www.ojjdp.gov/ojstatbb/ezacjrp/
  29. Walmsley, Roy (30 Jan 2009). World Prison Population List (8th Edition). From World Prison Population Lists. By World Pr
    http://www.prisonstudies.org/sites/default/files/resources/downloads/wppl-8th_41.pdf
  30. Liptak, Adam (23 Apr 2008). Inmate Count in US Dwarfs Other Nations'. [1]. The New York Times.
    https://www.nytimes.com/2008/04/23/us/23prison.html?pagewanted=print
  31. Correctional Populations in the United States, 2022 – Statistical Tables (NCJ 308699). From Bureau of Justice Statistics
    https://bjs.ojp.gov/library/publications/correctional-populations-united-states-2022-statistical-tables
  32. Rehavi and Starr (2012) "Racial Disparity in Federal Criminal Charging and Its Sentencing Consequences" Working Paper Se
    https://ssrn.com/abstract=1985377
  33. Alexander, Michelle (2010). The New Jim Crow: Mass Incarceration in the Age of Colorblindness. The New .mw- .mw- .mw- .m
    https://www.amazon.com/The-New-Crow-Incarceration-Colorblindness/dp/1595586431#reader_1595586431
  34. Greenberg, Jon. Kristof: U.S. imprisons blacks at rates higher than South Africa during apartheid. Politifact.
    http://www.politifact.com/punditfact/statements/2014/dec/11/nicholas-kristof/kristof-us-imprisons-blacks-rates-higher-south-afr
  35. Moore, Antonio (4 Aug 2015). Mass Incarceration's Failure: America's Bias in Arrest, Conviction and Sentencing. Huffingt
    http://www.huffingtonpost.com/antonio-moore/the-fallout-from-american_b_7919712.html
  36. The Russian economy: from Lenin to Putin. By Steven Rosefielde
    https://books.google.com/books?id=L4s1H9v2yOwC&q=gulag+population&pg=PA95
  37. Gulag: a history. By Anne Applebaum
    https://books.google.com/books?id=8fIfmxAs_T0C&q=gulag+total+population&pg=PA446
  38. EText (archived)
    https://web.archive.org/web/20081228031043/http://www.etext.org/Politics/Staljin/Staljin/articles/AHR/AHR.html
  39. Gopnik, Adam (30 January 2012). The Caging of America. The New Yorker.
    http://www.newyorker.com/magazine/2012/01/30/the-caging-of-america
Image
Source:
Tip: Wheel or +/− to zoom, drag to pan, Esc to close.