Topzle Topzle

2018 United States House of Representatives elections

Updated: Wikipedia source

2018 United States House of Representatives elections

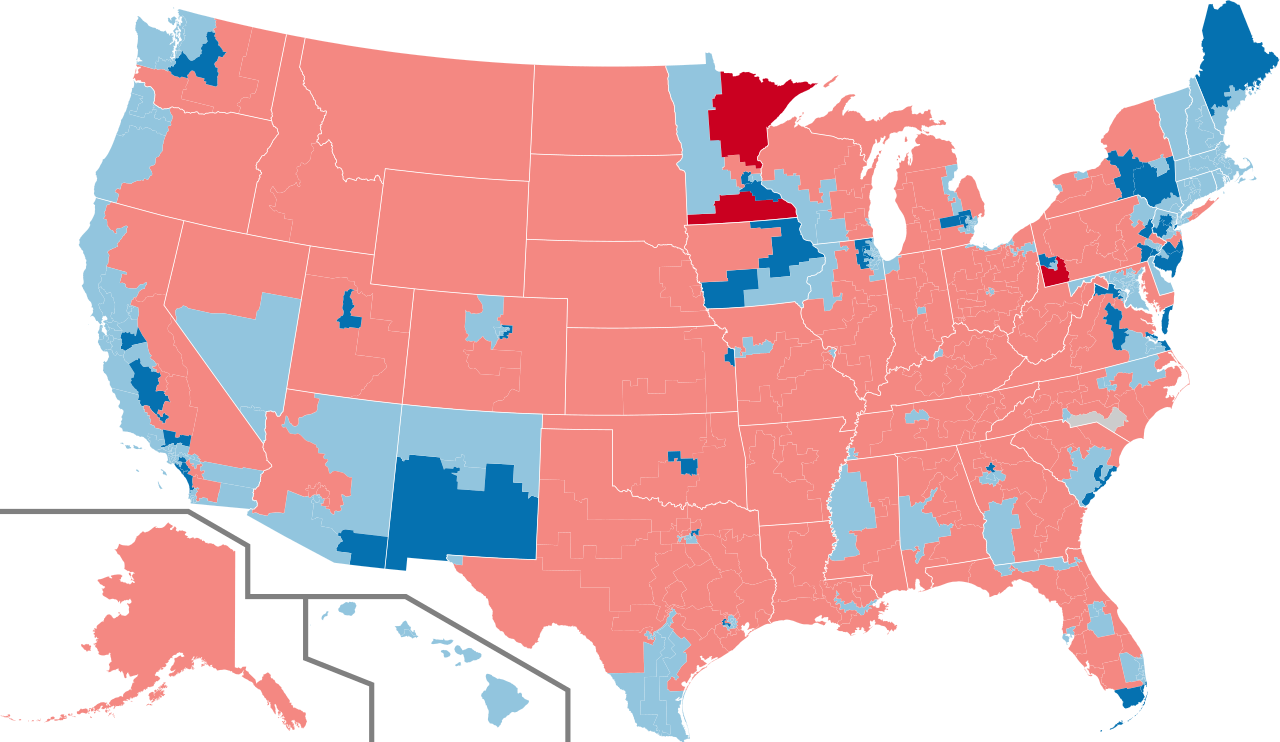
The 2018 United States House of Representatives elections were held on November 6, 2018. The 2018 House elections were midterm elections that occurred during President Donald Trump's first term in office. Early voting took place in some states in the weeks preceding Election Day. Voters chose representatives from all 435 congressional districts across each of the 50 U.S. states to serve in the 116th United States Congress. Prior to the 2018 elections, the Republican Party had held the House majority since January 2011. Led by House Minority Leader Nancy Pelosi, the Democratic Party won control of the House of Representatives in the 2018 elections. The Democrats gained a net total of 41 seats. The 41-seat gain was the Democrats' largest gain of House seats since the post-Watergate 1974 elections, when they picked up 49 seats. Democrats also won the popular vote by an 8.6% margin, the largest margin of victory on record for a minority party.

Infobox

Turnout
50.3% 4.4 pp
Leader
Nancy Pelosi
Party
Democratic
Leader since
January 3, 2003
Leader's seat
California 12th
Last election
194 seats, 48.0%
Seats won
235[b]
Seat change
41[c]
Popular vote
60,572,245
Percentage
53.4%
Swing
5 pp

Tables

· Results summary and analysis
2016
2016
Parties
2016
Parties
2018
Seats
+/−
Seats
Strength
Seats
Vote
Seats
%
Popular vote
Change
Totals
Totals
Parties
Totals
Parties
435
Seats
435
Seats
0
Seats
100.0%
Seats
113,412,989
Popular vote
100.0%
Popular vote
Source:
Source:
Parties
Source:
Parties
Seats
Popular vote
2016
2018
+/−
Strength
Vote
%
Change
Democratic Party
194
235
41
54.0%
60,572,245
53.4%
+5.4%
Republican Party
241
199
42
45.7%
50,861,970
44.8%
–4.3%
Libertarian Party
758,492
0.7%
–0.6%
Independent
569,502
0.5%
–0.2%
Green Party
247,231
0.2%
–0.2%
Constitution Party
59,972
0.1%
Others
343,577
0.3%
–0.1%
Totals
435
435
0
100.0%
113,412,989
100.0%
Source:
· Results summary and analysis › Partisan shifts by state
Seats
Seats
State
Seats
Totalseats
Change
Democratic
Seats
Democratic
Change
Alabama
Alabama
State
Alabama
Totalseats
7
Democratic
1
Democratic
Republican
6
Republican
Alaska
Alaska
State
Alaska
Totalseats
1
Democratic
0
Democratic
Republican
1
Republican
Arizona
Arizona
State
Arizona
Totalseats
9
Democratic
5
Democratic
1
Republican
4
Republican
1
Arkansas
Arkansas
State
Arkansas
Totalseats
4
Democratic
0
Democratic
Republican
4
Republican
California
California
State
California
Totalseats
53
Democratic
46
Democratic
7
Republican
7
Republican
7
Colorado
Colorado
State
Colorado
Totalseats
7
Democratic
4
Democratic
1
Republican
3
Republican
1
Connecticut
Connecticut
State
Connecticut
Totalseats
5
Democratic
5
Democratic
Republican
0
Republican
Delaware
Delaware
State
Delaware
Totalseats
1
Democratic
1
Democratic
Republican
0
Republican
Florida
Florida
State
Florida
Totalseats
27
Democratic
13
Democratic
2
Republican
14
Republican
2
Georgia
Georgia
State
Georgia
Totalseats
14
Democratic
5
Democratic
1
Republican
9
Republican
1
Hawaii
Hawaii
State
Hawaii
Totalseats
2
Democratic
2
Democratic
Republican
0
Republican
Idaho
Idaho
State
Idaho
Totalseats
2
Democratic
0
Democratic
Republican
2
Republican
Illinois
Illinois
State
Illinois
Totalseats
18
Democratic
13
Democratic
2
Republican
5
Republican
2
Indiana
Indiana
State
Indiana
Totalseats
9
Democratic
2
Democratic
Republican
7
Republican
Iowa
Iowa
State
Iowa
Totalseats
4
Democratic
3
Democratic
2
Republican
1
Republican
2
Kansas
Kansas
State
Kansas
Totalseats
4
Democratic
1
Democratic
1
Republican
3
Republican
1
Kentucky
Kentucky
State
Kentucky
Totalseats
6
Democratic
1
Democratic
Republican
5
Republican
Louisiana
Louisiana
State
Louisiana
Totalseats
6
Democratic
1
Democratic
Republican
5
Republican
Maine
Maine
State
Maine
Totalseats
2
Democratic
2
Democratic
1
Republican
0
Republican
1
Maryland
Maryland
State
Maryland
Totalseats
8
Democratic
7
Democratic
Republican
1
Republican
Massachusetts
Massachusetts
State
Massachusetts
Totalseats
9
Democratic
9
Democratic
Republican
0
Republican
Michigan
Michigan
State
Michigan
Totalseats
14
Democratic
7
Democratic
2
Republican
7
Republican
2
Minnesota
Minnesota
State
Minnesota
Totalseats
8
Democratic
5
Democratic
Republican
3
Republican
Mississippi
Mississippi
State
Mississippi
Totalseats
4
Democratic
1
Democratic
Republican
3
Republican
Missouri
Missouri
State
Missouri
Totalseats
8
Democratic
2
Democratic
Republican
6
Republican
Montana
Montana
State
Montana
Totalseats
1
Democratic
0
Democratic
Republican
1
Republican
Nebraska
Nebraska
State
Nebraska
Totalseats
3
Democratic
0
Democratic
Republican
3
Republican
Nevada
Nevada
State
Nevada
Totalseats
4
Democratic
3
Democratic
Republican
1
Republican
New Hampshire
New Hampshire
State
New Hampshire
Totalseats
2
Democratic
2
Democratic
Republican
0
Republican
New Jersey
New Jersey
State
New Jersey
Totalseats
12
Democratic
11
Democratic
4
Republican
1
Republican
4
New Mexico
New Mexico
State
New Mexico
Totalseats
3
Democratic
3
Democratic
1
Republican
0
Republican
1
New York
New York
State
New York
Totalseats
27
Democratic
21
Democratic
3
Republican
6
Republican
3
North Carolina
North Carolina
State
North Carolina
Totalseats
13
Democratic
3
Democratic
Republican
9
Republican
1
North Dakota
North Dakota
State
North Dakota
Totalseats
1
Democratic
0
Democratic
Republican
1
Republican
Ohio
Ohio
State
Ohio
Totalseats
16
Democratic
4
Democratic
Republican
12
Republican
Oklahoma
Oklahoma
State
Oklahoma
Totalseats
5
Democratic
1
Democratic
1
Republican
4
Republican
1
Oregon
Oregon
State
Oregon
Totalseats
5
Democratic
4
Democratic
Republican
1
Republican
Pennsylvania
Pennsylvania
State
Pennsylvania
Totalseats
18
Democratic
9
Democratic
4
Republican
9
Republican
4
Rhode Island
Rhode Island
State
Rhode Island
Totalseats
2
Democratic
2
Democratic
Republican
0
Republican
South Carolina
South Carolina
State
South Carolina
Totalseats
7
Democratic
2
Democratic
1
Republican
5
Republican
1
South Dakota
South Dakota
State
South Dakota
Totalseats
1
Democratic
0
Democratic
Republican
1
Republican
Tennessee
Tennessee
State
Tennessee
Totalseats
9
Democratic
2
Democratic
Republican
7
Republican
Texas
Texas
State
Texas
Totalseats
36
Democratic
13
Democratic
2
Republican
23
Republican
2
Utah
Utah
State
Utah
Totalseats
4
Democratic
1
Democratic
1
Republican
3
Republican
1
Vermont
Vermont
State
Vermont
Totalseats
1
Democratic
1
Democratic
Republican
0
Republican
Virginia
Virginia
State
Virginia
Totalseats
11
Democratic
7
Democratic
3
Republican
4
Republican
3
Washington
Washington
State
Washington
Totalseats
10
Democratic
7
Democratic
1
Republican
3
Republican
1
West Virginia
West Virginia
State
West Virginia
Totalseats
3
Democratic
0
Democratic
Republican
3
Republican
Wisconsin
Wisconsin
State
Wisconsin
Totalseats
8
Democratic
3
Democratic
Republican
5
Republican
Wyoming
Wyoming
State
Wyoming
Totalseats
1
Democratic
0
Democratic
Republican
1
Republican
Total
Total
State
Total
Totalseats
435
Democratic
235
Democratic
41
Republican
199
Republican
42
State
Totalseats
Democratic
Republican
Seats
Change
Seats
Change
Alabama
7
1
6
Alaska
1
0
1
Arizona
9
5
1
4
1
Arkansas
4
0
4
California
53
46
7
7
7
Colorado
7
4
1
3
1
Connecticut
5
5
0
Delaware
1
1
0
Florida
27
13
2
14
2
Georgia
14
5
1
9
1
Hawaii
2
2
0
Idaho
2
0
2
Illinois
18
13
2
5
2
Indiana
9
2
7
Iowa
4
3
2
1
2
Kansas
4
1
1
3
1
Kentucky
6
1
5
Louisiana
6
1
5
Maine
2
2
1
0
1
Maryland
8
7
1
Massachusetts
9
9
0
Michigan
14
7
2
7
2
Minnesota
8
5
3
Mississippi
4
1
3
Missouri
8
2
6
Montana
1
0
1
Nebraska
3
0
3
Nevada
4
3
1
New Hampshire
2
2
0
New Jersey
12
11
4
1
4
New Mexico
3
3
1
0
1
New York
27
21
3
6
3
North Carolina
13
3
9
1
North Dakota
1
0
1
Ohio
16
4
12
Oklahoma
5
1
1
4
1
Oregon
5
4
1
Pennsylvania
18
9
4
9
4
Rhode Island
2
2
0
South Carolina
7
2
1
5
1
South Dakota
1
0
1
Tennessee
9
2
7
Texas
36
13
2
23
2
Utah
4
1
1
3
1
Vermont
1
1
0
Virginia
11
7
3
4
3
Washington
10
7
1
3
1
West Virginia
3
0
3
· Closest races
Georgia 7th
Georgia 7th
District
Georgia 7th
Winner
Republican
Margin
0.15%
Utah 4th
Utah 4th
District
Utah 4th
Winner
Democratic (flip)
Margin
0.26%
North Carolina 9th
North Carolina 9th
District
North Carolina 9th
Winner
Republican
Margin
0.32%
New York 27th
New York 27th
District
New York 27th
Winner
Republican
Margin
0.38%
Texas 23rd
Texas 23rd
District
Texas 23rd
Winner
Republican
Margin
0.43%
Minnesota 1st
Minnesota 1st
District
Minnesota 1st
Winner
Republican (flip)
Margin
0.45%
California 21st
California 21st
District
California 21st
Winner
Democratic (flip)
Margin
0.74%
Illinois 13th
Illinois 13th
District
Illinois 13th
Winner
Republican
Margin
0.76%
Kansas 2nd
Kansas 2nd
District
Kansas 2nd
Winner
Republican
Margin
0.85%
Georgia 6th
Georgia 6th
District
Georgia 6th
Winner
Democratic (flip)
Margin
1.03%
Maine 2nd
Maine 2nd
District
Maine 2nd
Winner
Democratic (flip)
Margin
1.24%
New Jersey 3rd
New Jersey 3rd
District
New Jersey 3rd
Winner
Democratic (flip)
Margin
1.29%
South Carolina 1st
South Carolina 1st
District
South Carolina 1st
Winner
Democratic (flip)
Margin
1.39%
Oklahoma 5th
Oklahoma 5th
District
Oklahoma 5th
Winner
Democratic (flip)
Margin
1.40%
Florida 26th
Florida 26th
District
Florida 26th
Winner
Democratic (flip)
Margin
1.75%
New York 22nd
New York 22nd
District
New York 22nd
Winner
Democratic (flip)
Margin
1.78%
New Mexico 2nd
New Mexico 2nd
District
New Mexico 2nd
Winner
Democratic (flip)
Margin
1.87%
Virginia 7th
Virginia 7th
District
Virginia 7th
Winner
Democratic (flip)
Margin
1.94%
Nebraska 2nd
Nebraska 2nd
District
Nebraska 2nd
Winner
Republican
Margin
1.99%
Iowa 3rd
Iowa 3rd
District
Iowa 3rd
Winner
Democratic (flip)
Margin
2.16%
Virginia 2nd
Virginia 2nd
District
Virginia 2nd
Winner
Democratic (flip)
Margin
2.24%
Pennsylvania 1st
Pennsylvania 1st
District
Pennsylvania 1st
Winner
Republican
Margin
2.52%
Pennsylvania 10th
Pennsylvania 10th
District
Pennsylvania 10th
Winner
Republican
Margin
2.64%
Texas 21st
Texas 21st
District
Texas 21st
Winner
Republican
Margin
2.82%
Texas 31st
Texas 31st
District
Texas 31st
Winner
Republican
Margin
3.00%
California 39th
California 39th
District
California 39th
Winner
Democratic (flip)
Margin
3.11%
Texas 24th
Texas 24th
District
Texas 24th
Winner
Republican
Margin
3.21%
Kentucky 6th
Kentucky 6th
District
Kentucky 6th
Winner
Republican
Margin
3.21%
Iowa 4th
Iowa 4th
District
Iowa 4th
Winner
Republican
Margin
3.33%
California 50th
California 50th
District
California 50th
Winner
Republican
Margin
3.48%
Michigan 8th
Michigan 8th
District
Michigan 8th
Winner
Democratic (flip)
Margin
3.83%
Missouri 2nd
Missouri 2nd
District
Missouri 2nd
Winner
Republican
Margin
3.95%
New York 1st
New York 1st
District
New York 1st
Winner
Republican
Margin
4.09%
California 45th
California 45th
District
California 45th
Winner
Democratic (flip)
Margin
4.10%
Ohio 12th
Ohio 12th
District
Ohio 12th
Winner
Republican
Margin
4.16%
Minnesota 7th
Minnesota 7th
District
Minnesota 7th
Winner
Democratic
Margin
4.26%
Texas 10th
Texas 10th
District
Texas 10th
Winner
Republican
Margin
4.27%
Pennsylvania 16th
Pennsylvania 16th
District
Pennsylvania 16th
Winner
Republican
Margin
4.28%
California 10th
California 10th
District
California 10th
Winner
Democratic (flip)
Margin
4.49%
Michigan 6th
Michigan 6th
District
Michigan 6th
Winner
Republican
Margin
4.55%
Montana at-large
Montana at-large
District
Montana at-large
Winner
Republican
Margin
4.63%
Washington 8th
Washington 8th
District
Washington 8th
Winner
Democratic (flip)
Margin
4.83%
Texas 22nd
Texas 22nd
District
Texas 22nd
Winner
Republican
Margin
4.98%
Illinois 14th
Illinois 14th
District
Illinois 14th
Winner
Democratic (flip)
Margin
5.00%
New Jersey 7th
New Jersey 7th
District
New Jersey 7th
Winner
Democratic (flip)
Margin
5.02%
Iowa 1st
Iowa 1st
District
Iowa 1st
Winner
Democratic (flip)
Margin
5.06%
Texas 7th
Texas 7th
District
Texas 7th
Winner
Democratic (flip)
Margin
5.06%
New York 19th
New York 19th
District
New York 19th
Winner
Democratic (flip)
Margin
5.21%
New York 24th
New York 24th
District
New York 24th
Winner
Republican
Margin
5.26%
Ohio 1st
Ohio 1st
District
Ohio 1st
Winner
Republican
Margin
5.36%
California 22nd
California 22nd
District
California 22nd
Winner
Republican
Margin
5.44%
North Carolina 2nd
North Carolina 2nd
District
North Carolina 2nd
Winner
Republican
Margin
5.45%
Minnesota 2nd
Minnesota 2nd
District
Minnesota 2nd
Winner
Democratic (flip)
Margin
5.50%
Minnesota 8th
Minnesota 8th
District
Minnesota 8th
Winner
Republican (flip)
Margin
5.54%
Washington 3rd
Washington 3rd
District
Washington 3rd
Winner
Republican
Margin
5.66%
North Carolina 13th
North Carolina 13th
District
North Carolina 13th
Winner
Republican
Margin
6.00%
Florida 27th
Florida 27th
District
Florida 27th
Winner
Democratic (flip)
Margin
6.00%
Florida 15th
Florida 15th
District
Florida 15th
Winner
Republican
Margin
6.04%
Illinois 12th
Illinois 12th
District
Illinois 12th
Winner
Republican
Margin
6.18%
New York 2nd
New York 2nd
District
New York 2nd
Winner
Republican
Margin
6.22%
Arkansas 2nd
Arkansas 2nd
District
Arkansas 2nd
Winner
Republican
Margin
6.31%
New York 11th
New York 11th
District
New York 11th
Winner
Democratic (flip)
Margin
6.45%
Texas 32nd
Texas 32nd
District
Texas 32nd
Winner
Democratic (flip)
Margin
6.50%
Virginia 5th
Virginia 5th
District
Virginia 5th
Winner
Republican
Margin
6.53%
Alaska at-large
Alaska at-large
District
Alaska at-large
Winner
Republican
Margin
6.58%
Michigan 11th
Michigan 11th
District
Michigan 11th
Winner
Democratic (flip)
Margin
6.67%
California 48th
California 48th
District
California 48th
Winner
Democratic (flip)
Margin
7.10%
Illinois 6th
Illinois 6th
District
Illinois 6th
Winner
Democratic (flip)
Margin
7.15%
Texas 2nd
Texas 2nd
District
Texas 2nd
Winner
Republican
Margin
7.29%
Michigan 7th
Michigan 7th
District
Michigan 7th
Winner
Republican
Margin
7.61%
Texas 6th
Texas 6th
District
Texas 6th
Winner
Republican
Margin
7.66%
New Jersey 2nd
New Jersey 2nd
District
New Jersey 2nd
Winner
Democratic (flip)
Margin
7.67%
Arizona 1st
Arizona 1st
District
Arizona 1st
Winner
Democratic
Margin
7.69%
Colorado 3rd
Colorado 3rd
District
Colorado 3rd
Winner
Republican
Margin
7.97%
Nevada 4th
Nevada 4th
District
Nevada 4th
Winner
Democratic
Margin
8.18%
California 4th
California 4th
District
California 4th
Winner
Republican
Margin
8.26%
New York 23rd
New York 23rd
District
New York 23rd
Winner
Republican
Margin
8.49%
New Hampshire 1st
New Hampshire 1st
District
New Hampshire 1st
Winner
Democratic
Margin
8.55%
Florida 18th
Florida 18th
District
Florida 18th
Winner
Republican
Margin
8.60%
California 25th
California 25th
District
California 25th
Winner
Democratic (flip)
Margin
8.73%
Texas 25th
Texas 25th
District
Texas 25th
Winner
Republican
Margin
8.75%
Nevada 3rd
Nevada 3rd
District
Nevada 3rd
Winner
Democratic
Margin
9.06%
Florida 16th
Florida 16th
District
Florida 16th
Winner
Republican
Margin
9.12%
Pennsylvania 8th
Pennsylvania 8th
District
Pennsylvania 8th
Winner
Democratic
Margin
9.29%
Arizona 2nd
Arizona 2nd
District
Arizona 2nd
Winner
Democratic (flip)
Margin
9.49%
Kansas 3rd
Kansas 3rd
District
Kansas 3rd
Winner
Democratic (flip)
Margin
9.66%
Indiana 2nd
Indiana 2nd
District
Indiana 2nd
Winner
Republican
Margin
9.67%
California 1st
California 1st
District
California 1st
Winner
Republican
Margin
9.77%
Washington 5th
Washington 5th
District
Washington 5th
Winner
Republican
Margin
9.86%
District
Winner
Margin
Georgia 7th
Republican
0.15%
Utah 4th
Democratic (flip)
0.26%
North Carolina 9th
Republican
0.32%
New York 27th
Republican
0.38%
Texas 23rd
Republican
0.43%
Minnesota 1st
Republican (flip)
0.45%
California 21st
Democratic (flip)
0.74%
Illinois 13th
Republican
0.76%
Kansas 2nd
Republican
0.85%
Georgia 6th
Democratic (flip)
1.03%
Maine 2nd
Democratic (flip)
1.24%
New Jersey 3rd
Democratic (flip)
1.29%
South Carolina 1st
Democratic (flip)
1.39%
Oklahoma 5th
Democratic (flip)
1.40%
Florida 26th
Democratic (flip)
1.75%
New York 22nd
Democratic (flip)
1.78%
New Mexico 2nd
Democratic (flip)
1.87%
Virginia 7th
Democratic (flip)
1.94%
Nebraska 2nd
Republican
1.99%
Iowa 3rd
Democratic (flip)
2.16%
Virginia 2nd
Democratic (flip)
2.24%
Pennsylvania 1st
Republican
2.52%
Pennsylvania 10th
Republican
2.64%
Texas 21st
Republican
2.82%
Texas 31st
Republican
3.00%
California 39th
Democratic (flip)
3.11%
Texas 24th
Republican
3.21%
Kentucky 6th
Republican
3.21%
Iowa 4th
Republican
3.33%
California 50th
Republican
3.48%
Michigan 8th
Democratic (flip)
3.83%
Missouri 2nd
Republican
3.95%
New York 1st
Republican
4.09%
California 45th
Democratic (flip)
4.10%
Ohio 12th
Republican
4.16%
Minnesota 7th
Democratic
4.26%
Texas 10th
Republican
4.27%
Pennsylvania 16th
Republican
4.28%
California 10th
Democratic (flip)
4.49%
Michigan 6th
Republican
4.55%
Montana at-large
Republican
4.63%
Washington 8th
Democratic (flip)
4.83%
Texas 22nd
Republican
4.98%
Illinois 14th
Democratic (flip)
5.00%
New Jersey 7th
Democratic (flip)
5.02%
Iowa 1st
Democratic (flip)
5.06%
Texas 7th
Democratic (flip)
5.06%
New York 19th
Democratic (flip)
5.21%
New York 24th
Republican
5.26%
· Special elections
Member
Member
District
Member
Incumbent
Party
Incumbent
First elected
Incumbent
Results
This race
Candidates
Pennsylvania 18
Pennsylvania 18
District
Pennsylvania 18
Incumbent
Tim Murphy
Incumbent
Republican
Incumbent
2002
This race
Incumbent resigned October 21, 2017.New member elected March 13, 2018.Democratic gain.
This race
mw- .mw- ▌Y Conor Lamb (Democratic) 49.9% ▌Rick Saccone (Republican) 49.5%
Arizona 8
Arizona 8
District
Arizona 8
Incumbent
Trent Franks
Incumbent
Republican
Incumbent
2002
This race
Incumbent resigned December 8, 2017.New member elected April 24, 2018.Republican hold.
This race
▌Y Debbie Lesko (Republican) 52.4% ▌Hiral Tipirneni (Democratic) 47.6%
Texas 27
Texas 27
District
Texas 27
Incumbent
Blake Farenthold
Incumbent
Republican
Incumbent
2010
This race
Incumbent resigned April 6, 2018.New member elected June 30, 2018.Republican hold.
This race
▌Y Michael Cloud (Republican) 54.7% ▌Eric Holguin (Democratic) 32.0% ▌Roy Barrera (Democratic) 4.8% ▌Bech Bruun (Republican) 4.3% ▌Mike Westergren (Democratic) 2.4%
Ohio 12
Ohio 12
District
Ohio 12
Incumbent
Pat Tiberi
Incumbent
Republican
Incumbent
2000
This race
Incumbent resigned January 15, 2018.New member elected August 7, 2018.Republican hold.
This race
▌Y Troy Balderson (Republican) 50.1% ▌Danny O'Connor (Democratic) 49.3%
Michigan 13
Michigan 13
District
Michigan 13
Incumbent
John Conyers
Incumbent
Democratic
Incumbent
1964
This race
Incumbent resigned December 5, 2017.New member elected November 6, 2018.Democratic hold.
This race
▌Y Brenda Jones (Democratic) 86.9% ▌Marc Sosnowski (Taxpayers) 8.9% ▌D. Etta Wilcoxon (Green) 4.3%
New York 25
New York 25
District
New York 25
Incumbent
Louise Slaughter
Incumbent
Democratic
Incumbent
1986
This race
Incumbent died March 16, 2018.New member elected November 6, 2018.Democratic hold.
This race
▌Y Joseph Morelle (Democratic) 58.3% ▌Jim Maxwell (Republican) 41.7%
Pennsylvania 7
Pennsylvania 7
District
Pennsylvania 7
Incumbent
Pat Meehan
Incumbent
Republican
Incumbent
2010
This race
Incumbent resigned April 27, 2018.New member elected November 6, 2018.Democratic gain.
This race
▌Y Mary Gay Scanlon (Democratic) 52.3% ▌Pearl Kim (Republican) 46.0% ▌Sandra Teresa Salas (Libertarian) 1.0%
Pennsylvania 15
Pennsylvania 15
District
Pennsylvania 15
Incumbent
Charlie Dent
Incumbent
Republican
Incumbent
2004
This race
Incumbent resigned May 12, 2018.New member elected November 6, 2018.Democratic gain.
This race
▌Y Susan Wild (Democratic) 48.5% ▌Marty Nothstein (Republican) 48.3% ▌Tim Silfies (Libertarian) 3.2%
District
Incumbent
This race
Member
Party
First elected
Results
Candidates
Pennsylvania 18
Tim Murphy
Republican
2002
Incumbent resigned October 21, 2017.New member elected March 13, 2018.Democratic gain.
mw- ▌Y Conor Lamb (Democratic) 49.9% ▌Rick Saccone (Republican) 49.5%
Arizona 8
Trent Franks
Republican
2002
Incumbent resigned December 8, 2017.New member elected April 24, 2018.Republican hold.
▌Y Debbie Lesko (Republican) 52.4% ▌Hiral Tipirneni (Democratic) 47.6%
Texas 27
Blake Farenthold
Republican
2010
Incumbent resigned April 6, 2018.New member elected June 30, 2018.Republican hold.
▌Y Michael Cloud (Republican) 54.7% ▌Eric Holguin (Democratic) 32.0% ▌Roy Barrera (Democratic) 4.8% ▌Bech Bruun (Republican) 4.3% ▌Mike Westergren (Democratic) 2.4%
Ohio 12
Pat Tiberi
Republican
2000
Incumbent resigned January 15, 2018.New member elected August 7, 2018.Republican hold.
▌Y Troy Balderson (Republican) 50.1% ▌Danny O'Connor (Democratic) 49.3%
Michigan 13
John Conyers
Democratic
1964
Incumbent resigned December 5, 2017.New member elected November 6, 2018.Democratic hold.
▌Y Brenda Jones (Democratic) 86.9% ▌Marc Sosnowski (Taxpayers) 8.9% ▌D. Etta Wilcoxon (Green) 4.3%
New York 25
Louise Slaughter
Democratic
1986
Incumbent died March 16, 2018.New member elected November 6, 2018.Democratic hold.
▌Y Joseph Morelle (Democratic) 58.3% ▌Jim Maxwell (Republican) 41.7%
Pennsylvania 7
Pat Meehan
Republican
2010
Incumbent resigned April 27, 2018.New member elected November 6, 2018.Democratic gain.
▌Y Mary Gay Scanlon (Democratic) 52.3% ▌Pearl Kim (Republican) 46.0% ▌Sandra Teresa Salas (Libertarian) 1.0%
Pennsylvania 15
Charlie Dent
Republican
2004
Incumbent resigned May 12, 2018.New member elected November 6, 2018.Democratic gain.
▌Y Susan Wild (Democratic) 48.5% ▌Marty Nothstein (Republican) 48.3% ▌Tim Silfies (Libertarian) 3.2%
· Exit poll
Total vote
Total vote
Response category
Total vote
DEM
53
GOP
45
% oftotal vote
100
Ideology
Ideology
Response category
Ideology
Liberals
Liberals
Response category
Liberals
DEM
91
GOP
8
% oftotal vote
27
Moderates
Moderates
Response category
Moderates
DEM
62
GOP
36
% oftotal vote
37
Conservatives
Conservatives
Response category
Conservatives
DEM
16
GOP
83
% oftotal vote
36
Party
Party
Response category
Party
Democrats
Democrats
Response category
Democrats
DEM
95
GOP
4
% oftotal vote
37
Republicans
Republicans
Response category
Republicans
DEM
6
GOP
94
% oftotal vote
33
Independents
Independents
Response category
Independents
DEM
54
GOP
42
% oftotal vote
30
Party by gender
Party by gender
Response category
Party by gender
Democratic men
Democratic men
Response category
Democratic men
DEM
94
GOP
5
% oftotal vote
14
Democratic women
Democratic women
Response category
Democratic women
DEM
96
GOP
3
% oftotal vote
23
Republican men
Republican men
Response category
Republican men
DEM
6
GOP
94
% oftotal vote
17
Republican women
Republican women
Response category
Republican women
DEM
6
GOP
93
% oftotal vote
16
Independent men
Independent men
Response category
Independent men
DEM
51
GOP
44
% oftotal vote
16
Independent women
Independent women
Response category
Independent women
DEM
57
GOP
39
% oftotal vote
13
Gender
Gender
Response category
Gender
Men
Men
Response category
Men
DEM
47
GOP
51
% oftotal vote
48
Women
Women
Response category
Women
DEM
59
GOP
40
% oftotal vote
52
Marital status
Marital status
Response category
Marital status
Married
Married
Response category
Married
DEM
51
GOP
48
% oftotal vote
59
Unmarried
Unmarried
Response category
Unmarried
DEM
61
GOP
37
% oftotal vote
41
Gender by marital status
Response category
Gender by marital status
Married men
Married men
Response category
Married men
DEM
48
GOP
51
% oftotal vote
30
Married women
Married women
Response category
Married women
DEM
55
GOP
44
% oftotal vote
29
Non-married men
Non-married men
Response category
Non-married men
DEM
54
GOP
44
% oftotal vote
18
Non-married women
Non-married women
Response category
Non-married women
DEM
66
GOP
32
% oftotal vote
23
Race/ethnicity
Race/ethnicity
Response category
Race/ethnicity
White
White
Response category
White
DEM
44
GOP
54
% oftotal vote
72
Black
Black
Response category
Black
DEM
90
GOP
9
% oftotal vote
11
Asian
Asian
Response category
Asian
DEM
77
GOP
23
% oftotal vote
3
Other
Other
Response category
Other
DEM
54
GOP
42
% oftotal vote
3
Hispanic (of any race)
Response category
Hispanic (of any race)
DEM
69
GOP
29
% oftotal vote
11
Gender by race/ethnicity
Response category
Gender by race/ethnicity
White men
White men
Response category
White men
DEM
39
GOP
60
% oftotal vote
35
White women
White women
Response category
White women
DEM
49
GOP
49
% oftotal vote
37
Black men
Black men
Response category
Black men
DEM
88
GOP
12
% oftotal vote
5
Black women
Black women
Response category
Black women
DEM
92
GOP
7
% oftotal vote
6
Latino men (of any race)
Response category
Latino men (of any race)
DEM
63
GOP
34
% oftotal vote
5
Latino women (of any race)
Response category
Latino women (of any race)
DEM
73
GOP
26
% oftotal vote
6
All other races
All other races
Response category
All other races
DEM
66
GOP
32
% oftotal vote
6
Religion
Religion
Response category
Religion
Protestant/Other Christian
Response category
Protestant/Other Christian
DEM
42
GOP
56
% oftotal vote
47
Catholic
Catholic
Response category
Catholic
DEM
50
GOP
49
% oftotal vote
26
Jewish
Jewish
Response category
Jewish
DEM
81
GOP
17
% oftotal vote
2
Other religion
Other religion
Response category
Other religion
DEM
73
GOP
25
% oftotal vote
8
None
None
Response category
None
DEM
70
GOP
28
% oftotal vote
17
Religious service attendance
Response category
Religious service attendance
Weekly or more
Weekly or more
Response category
Weekly or more
DEM
40
GOP
58
% oftotal vote
32
A few times a month
A few times a month
Response category
A few times a month
DEM
52
GOP
46
% oftotal vote
13
A few times a year
A few times a year
Response category
A few times a year
DEM
61
GOP
37
% oftotal vote
27
Never
Never
Response category
Never
DEM
68
GOP
30
% oftotal vote
27
White evangelical or born-again Christian
Response category
White evangelical or born-again Christian
Response category
White evangelical or born-again Christian
DEM
22
GOP
75
% oftotal vote
26
Everyone else
Everyone else
Response category
Everyone else
DEM
66
GOP
32
% oftotal vote
74
Age
Age
Response category
Age
18–24 years old
18–24 years old
Response category
18–24 years old
DEM
68
GOP
31
% oftotal vote
7
25–29 years old
25–29 years old
Response category
25–29 years old
DEM
66
GOP
33
% oftotal vote
6
30–39 years old
30–39 years old
Response category
30–39 years old
DEM
59
GOP
38
% oftotal vote
15
40–49 years old
40–49 years old
Response category
40–49 years old
DEM
52
GOP
46
% oftotal vote
16
50–64 years old
50–64 years old
Response category
50–64 years old
DEM
49
GOP
50
% oftotal vote
30
65 and older
65 and older
Response category
65 and older
DEM
48
GOP
50
% oftotal vote
26
Age by race
Age by race
Response category
Age by race
Whites 18–29 years old
Response category
Whites 18–29 years old
DEM
56
GOP
43
% oftotal vote
8
Whites 30–44 years old
Response category
Whites 30–44 years old
DEM
48
GOP
48
% oftotal vote
15
Whites 45–64 years old
Response category
Whites 45–64 years old
DEM
40
GOP
59
% oftotal vote
29
Whites 65 and older
Whites 65 and older
Response category
Whites 65 and older
DEM
43
GOP
56
% oftotal vote
22
Blacks 18–29 years old
Response category
Blacks 18–29 years old
DEM
92
GOP
7
% oftotal vote
2
Blacks 30–44 years old
Response category
Blacks 30–44 years old
DEM
92
GOP
7
% oftotal vote
3
Blacks 45–64 years old
Response category
Blacks 45–64 years old
DEM
88
GOP
11
% oftotal vote
5
Blacks 65 and older
Blacks 65 and older
Response category
Blacks 65 and older
DEM
88
GOP
11
% oftotal vote
2
Latinos 18–29 years old
Response category
Latinos 18–29 years old
DEM
81
GOP
17
% oftotal vote
2
Latinos 30–44 years old
Response category
Latinos 30–44 years old
DEM
74
GOP
25
% oftotal vote
2
Latinos 45–64 years old
Response category
Latinos 45–64 years old
DEM
63
GOP
35
% oftotal vote
3
Latinos 65 and older
Response category
Latinos 65 and older
DEM
71
GOP
25
% oftotal vote
2
Others
Others
Response category
Others
DEM
65
GOP
33
% oftotal vote
6
LGBT
LGBT
Response category
LGBT
Yes
Yes
Response category
Yes
DEM
82
GOP
17
% oftotal vote
6
No
No
Response category
No
DEM
51
GOP
47
% oftotal vote
94
Education
Education
Response category
Education
High school graduate/dropout
Response category
High school graduate/dropout
DEM
48
GOP
51
% oftotal vote
23
Some college education
Response category
Some college education
DEM
52
GOP
47
% oftotal vote
25
Associate degree
Associate degree
Response category
Associate degree
DEM
47
GOP
50
% oftotal vote
11
Bachelor's degree
Bachelor's degree
Response category
Bachelor's degree
DEM
55
GOP
43
% oftotal vote
24
Postgraduate education
Response category
Postgraduate education
DEM
65
GOP
34
% oftotal vote
17
Education by race/ethnicity
Response category
Education by race/ethnicity
White college graduates
Response category
White college graduates
DEM
53
GOP
45
% oftotal vote
31
White no college degree
Response category
White no college degree
DEM
37
GOP
61
% oftotal vote
41
Non-white college graduates
Response category
Non-white college graduates
DEM
77
GOP
22
% oftotal vote
10
Non-white no college degree
Response category
Non-white no college degree
DEM
76
GOP
22
% oftotal vote
18
Whites by education and gender
Response category
Whites by education and gender
White women with college degrees
Response category
White women with college degrees
DEM
59
GOP
39
% oftotal vote
16
White men with college degrees
Response category
White men with college degrees
DEM
47
GOP
51
% oftotal vote
15
White women without college degrees
Response category
White women without college degrees
DEM
42
GOP
56
% oftotal vote
21
White men without college degrees
Response category
White men without college degrees
DEM
32
GOP
66
% oftotal vote
20
Non-whites
Non-whites
Response category
Non-whites
DEM
76
GOP
22
% oftotal vote
28
Family income
Family income
Response category
Family income
Under $30,000
Under $30,000
Response category
Under $30,000
DEM
63
GOP
34
% oftotal vote
17
$30,000–49,999
$30,000–49,999
Response category
$30,000–49,999
DEM
57
GOP
41
% oftotal vote
21
$50,000–99,999
$50,000–99,999
Response category
$50,000–99,999
DEM
52
GOP
47
% oftotal vote
29
$100,000–199,999
$100,000–199,999
Response category
$100,000–199,999
DEM
47
GOP
51
% oftotal vote
25
Over $200,000
Over $200,000
Response category
Over $200,000
DEM
47
GOP
52
% oftotal vote
9
Military service
Military service
Response category
Military service
Veterans
Veterans
Response category
Veterans
DEM
41
GOP
58
% oftotal vote
14
Non-veterans
Non-veterans
Response category
Non-veterans
DEM
56
GOP
43
% oftotal vote
86
Community size
Community size
Response category
Community size
Urban
Urban
Response category
Urban
DEM
66
GOP
33
% oftotal vote
32
Suburban
Suburban
Response category
Suburban
DEM
49
GOP
49
% oftotal vote
51
Rural
Rural
Response category
Rural
DEM
42
GOP
56
% oftotal vote
17
Trump approval rating
Response category
Trump approval rating
Strongly disapprove
Strongly disapprove
Response category
Strongly disapprove
DEM
95
GOP
4
% oftotal vote
46
Somewhat disapprove
Somewhat disapprove
Response category
Somewhat disapprove
DEM
63
GOP
34
% oftotal vote
8
Somewhat approve
Somewhat approve
Response category
Somewhat approve
DEM
24
GOP
74
% oftotal vote
14
Strongly approve
Strongly approve
Response category
Strongly approve
DEM
5
GOP
94
% oftotal vote
31
Decided on U.S. House vote
Response category
Decided on U.S. House vote
Last few days
Last few days
Response category
Last few days
DEM
53
GOP
41
% oftotal vote
8
Last week
Last week
Response category
Last week
DEM
49
GOP
48
% oftotal vote
8
Last month
Last month
Response category
Last month
DEM
51
GOP
46
% oftotal vote
19
Earlier than that
Earlier than that
Response category
Earlier than that
DEM
52
GOP
47
% oftotal vote
63
Direction of the country
Response category
Direction of the country
Wrong track
Wrong track
Response category
Wrong track
DEM
85
GOP
13
% oftotal vote
54
Right direction
Right direction
Response category
Right direction
DEM
13
GOP
86
% oftotal vote
42
Do you think Americans are politically
Response category
Do you think Americans are politically
Becoming more divided
Response category
Becoming more divided
DEM
60
GOP
39
% oftotal vote
76
Staying about the same
Response category
Staying about the same
DEM
32
GOP
66
% oftotal vote
9
Becoming more united
Response category
Becoming more united
DEM
28
GOP
70
% oftotal vote
9
Issue regarded as most important
Response category
Issue regarded as most important
Health care
Health care
Response category
Health care
DEM
75
GOP
23
% oftotal vote
41
Immigration
Immigration
Response category
Immigration
DEM
23
GOP
75
% oftotal vote
23
Economy
Economy
Response category
Economy
DEM
34
GOP
63
% oftotal vote
22
Gun policy
Gun policy
Response category
Gun policy
DEM
70
GOP
29
% oftotal vote
10
Health care in the U.S. needs
Response category
Health care in the U.S. needs
Major changes
Major changes
Response category
Major changes
DEM
55
GOP
43
% oftotal vote
69
Minor changes
Minor changes
Response category
Minor changes
DEM
41
GOP
57
% oftotal vote
24
No changes
No changes
Response category
No changes
DEM
40
GOP
60
% oftotal vote
4
Who would better protect pre-existing conditions
Response category
Who would better protect pre-existing conditions
Democrats
Democrats
Response category
Democrats
DEM
89
GOP
9
% oftotal vote
57
Republicans
Republicans
Response category
Republicans
DEM
4
GOP
94
% oftotal vote
35
Are Donald Trump's immigration policies
Response category
Are Donald Trump's immigration policies
Too tough
Too tough
Response category
Too tough
DEM
90
GOP
8
% oftotal vote
46
About right
About right
Response category
About right
DEM
13
GOP
85
% oftotal vote
33
Not tough enough
Not tough enough
Response category
Not tough enough
DEM
14
GOP
86
% oftotal vote
17
Condition of the nation's economy
Response category
Condition of the nation's economy
Excellent
Excellent
Response category
Excellent
DEM
12
GOP
87
% oftotal vote
17
Good
Good
Response category
Good
DEM
47
GOP
51
% oftotal vote
51
Not so good
Not so good
Response category
Not so good
DEM
83
GOP
15
% oftotal vote
23
Poor
Poor
Response category
Poor
DEM
85
GOP
8
% oftotal vote
7
Family's financial situation today
Response category
Family's financial situation today
Better than two years ago
Response category
Better than two years ago
DEM
21
GOP
77
% oftotal vote
36
About the same
About the same
Response category
About the same
DEM
69
GOP
29
% oftotal vote
49
Worse than two years ago
Response category
Worse than two years ago
DEM
80
GOP
18
% oftotal vote
14
Effect of Trump's trade policies on local economy
Response category
Effect of Trump's trade policies on local economy
Helped
Helped
Response category
Helped
DEM
9
GOP
91
% oftotal vote
25
Hurt
Hurt
Response category
Hurt
DEM
89
GOP
8
% oftotal vote
29
Had no impact
Had no impact
Response category
Had no impact
DEM
53
GOP
45
% oftotal vote
37
Effect of new tax laws on your personal finances
Response category
Effect of new tax laws on your personal finances
Helped
Helped
Response category
Helped
DEM
15
GOP
84
% oftotal vote
29
Hurt
Hurt
Response category
Hurt
DEM
83
GOP
15
% oftotal vote
22
Had no impact
Had no impact
Response category
Had no impact
DEM
62
GOP
36
% oftotal vote
45
Does anyone in household own a gun
Response category
Does anyone in household own a gun
Yes
Yes
Response category
Yes
DEM
36
GOP
61
% oftotal vote
46
No
No
Response category
No
DEM
72
GOP
26
% oftotal vote
53
Views on stricter gun control measures
Response category
Views on stricter gun control measures
Support
Support
Response category
Support
DEM
76
GOP
22
% oftotal vote
59
Oppose
Oppose
Response category
Oppose
DEM
22
GOP
76
% oftotal vote
37
View of the Russia investigation
Response category
View of the Russia investigation
Politically motivated
Response category
Politically motivated
DEM
25
GOP
73
% oftotal vote
54
Mostly justified
Mostly justified
Response category
Mostly justified
DEM
85
GOP
14
% oftotal vote
41
View of Mueller's handling of Russia investigation
Response category
View of Mueller's handling of Russia investigation
Approve
Approve
Response category
Approve
DEM
79
GOP
19
% oftotal vote
41
Disapprove
Disapprove
Response category
Disapprove
DEM
28
GOP
71
% oftotal vote
46
Has the government done enough to protect the election
Response category
Has the government done enough to protect the election
Yes
Yes
Response category
Yes
DEM
27
GOP
71
% oftotal vote
38
No
No
Response category
No
DEM
75
GOP
24
% oftotal vote
50
Does Trump's foreign policy make the U.S.
Response category
Does Trump's foreign policy make the U.S.
Safer
Safer
Response category
Safer
DEM
8
GOP
91
% oftotal vote
38
Less safe
Less safe
Response category
Less safe
DEM
90
GOP
9
% oftotal vote
46
No difference
No difference
Response category
No difference
DEM
60
GOP
38
% oftotal vote
13
View of Kavanaugh's Supreme Court appointment
Response category
View of Kavanaugh's Supreme Court appointment
Support
Support
Response category
Support
DEM
12
GOP
87
% oftotal vote
43
Oppose
Oppose
Response category
Oppose
DEM
90
GOP
9
% oftotal vote
47
How should the Supreme Court handle Roe v. Wade
Response category
How should the Supreme Court handle Roe v. Wade
Keep as is
Keep as is
Response category
Keep as is
DEM
69
GOP
30
% oftotal vote
66
Overturn it
Overturn it
Response category
Overturn it
DEM
21
GOP
79
% oftotal vote
25
Sexual harassment in this country today is
Response category
Sexual harassment in this country today is
A very serious problem
Response category
A very serious problem
DEM
72
GOP
26
% oftotal vote
46
Somewhat serious problem
Response category
Somewhat serious problem
DEM
48
GOP
50
% oftotal vote
38
Not too serious a problem
Response category
Not too serious a problem
DEM
20
GOP
79
% oftotal vote
11
Not a serious problem
Response category
Not a serious problem
DEM
N/A
GOP
N/A
% oftotal vote
3
In the U.S. today
In the U.S. today
Response category
In the U.S. today
Whites are favored
Whites are favored
Response category
Whites are favored
DEM
87
GOP
9
% oftotal vote
41
Minorities are favored
Response category
Minorities are favored
DEM
12
GOP
85
% oftotal vote
19
No group is favored
No group is favored
Response category
No group is favored
DEM
29
GOP
69
% oftotal vote
33
In your vote today, was recent extremist violence
Response category
In your vote today, was recent extremist violence
The most important factor
Response category
The most important factor
DEM
62
GOP
37
% oftotal vote
23
An important factor
An important factor
Response category
An important factor
DEM
51
GOP
48
% oftotal vote
51
A minor factor
A minor factor
Response category
A minor factor
DEM
38
GOP
60
% oftotal vote
9
Not a factor at all
Not a factor at all
Response category
Not a factor at all
DEM
36
GOP
61
% oftotal vote
9
Importance of electing racial/ethnic minorities
Response category
Importance of electing racial/ethnic minorities
Very important
Very important
Response category
Very important
DEM
79
GOP
20
% oftotal vote
43
Somewhat important
Somewhat important
Response category
Somewhat important
DEM
44
GOP
55
% oftotal vote
29
Not too important
Not too important
Response category
Not too important
DEM
20
GOP
79
% oftotal vote
10
Not at all important
Response category
Not at all important
DEM
12
GOP
84
% oftotal vote
18
Importance of electing more women to public office
Response category
Importance of electing more women to public office
Very important
Very important
Response category
Very important
DEM
82
GOP
17
% oftotal vote
45
Somewhat important
Somewhat important
Response category
Somewhat important
DEM
45
GOP
52
% oftotal vote
33
Not too important
Not too important
Response category
Not too important
DEM
17
GOP
80
% oftotal vote
12
Not at all important
Response category
Not at all important
DEM
8
GOP
90
% oftotal vote
8
The greater concern is that some people will
Response category
The greater concern is that some people will
Be prevented from voting
Response category
Be prevented from voting
DEM
80
GOP
18
% oftotal vote
53
Cast illegitimate votes
Response category
Cast illegitimate votes
DEM
21
GOP
78
% oftotal vote
36
Response category
DEM
GOP
% oftotal vote
Total vote
53
45
100
Ideology
Liberals
91
8
27
Moderates
62
36
37
Conservatives
16
83
36
Party
Democrats
95
4
37
Republicans
6
94
33
Independents
54
42
30
Party by gender
Democratic men
94
5
14
Democratic women
96
3
23
Republican men
6
94
17
Republican women
6
93
16
Independent men
51
44
16
Independent women
57
39
13
Gender
Men
47
51
48
Women
59
40
52
Marital status
Married
51
48
59
Unmarried
61
37
41
Gender by marital status
Married men
48
51
30
Married women
55
44
29
Non-married men
54
44
18
Non-married women
66
32
23
Race/ethnicity
White
44
54
72
Black
90
9
11
Asian
77
23
3
Other
54
42
3
Hispanic (of any race)
69
29
11
Gender by race/ethnicity
White men
39
60
35
White women
49
49
37
Black men
88
12
5
Black women
92
7
6
Latino men (of any race)
63
34
5
Latino women (of any race)
73
26
6
All other races
66
32
6
Religion
Protestant/Other Christian
42
56
47
Catholic
50
49
26
Jewish
81
17
2
Other religion
73
25
8
None
70
28
17
Religious service attendance
Weekly or more
40
58
32
· Election dates
Alabama
Alabama
State/territory
Alabama
Filingdeadline
February 9, 2018
Primaryelection
June 5, 2018
Primaryrunoff(if necessary)
July 17, 2018
Generalelection
November 6, 2018
Poll closing(Eastern Time)
8pm
Alaska
Alaska
State/territory
Alaska
Filingdeadline
June 1, 2018
Primaryelection
August 21, 2018
Primaryrunoff(if necessary)
N/A
Generalelection
November 6, 2018
Poll closing(Eastern Time)
Midnight & 1am
American Samoa
American Samoa
State/territory
American Samoa
Filingdeadline
September 1, 2018
Primaryelection
N/A
Primaryrunoff(if necessary)
N/A
Generalelection
November 6, 2018
Poll closing(Eastern Time)
12am
Arizona
Arizona
State/territory
Arizona
Filingdeadline
May 30, 2018
Primaryelection
August 28, 2018
Primaryrunoff(if necessary)
N/A
Generalelection
November 6, 2018
Poll closing(Eastern Time)
9pm
Arkansas
Arkansas
State/territory
Arkansas
Filingdeadline
March 1, 2018
Primaryelection
May 22, 2018
Primaryrunoff(if necessary)
June 19, 2018
Generalelection
November 6, 2018
Poll closing(Eastern Time)
8:30pm
California
California
State/territory
California
Filingdeadline
March 9, 2018
Primaryelection
June 5, 2018
Primaryrunoff(if necessary)
N/A
Generalelection
November 6, 2018
Poll closing(Eastern Time)
11pm
Colorado
Colorado
State/territory
Colorado
Filingdeadline
March 20, 2018
Primaryelection
June 26, 2018
Primaryrunoff(if necessary)
N/A
Generalelection
November 6, 2018
Poll closing(Eastern Time)
9pm
Connecticut
Connecticut
State/territory
Connecticut
Filingdeadline
June 12, 2018
Primaryelection
August 14, 2018
Primaryrunoff(if necessary)
N/A
Generalelection
November 6, 2018
Poll closing(Eastern Time)
8pm
Delaware
Delaware
State/territory
Delaware
Filingdeadline
July 10, 2018
Primaryelection
September 6, 2018
Primaryrunoff(if necessary)
N/A
Generalelection
November 6, 2018
Poll closing(Eastern Time)
8pm
District of Columbia
State/territory
District of Columbia
Filingdeadline
March 21, 2018
Primaryelection
June 19, 2018
Primaryrunoff(if necessary)
N/A
Generalelection
November 6, 2018
Poll closing(Eastern Time)
8pm
Florida
Florida
State/territory
Florida
Filingdeadline
May 4, 2018
Primaryelection
August 28, 2018
Primaryrunoff(if necessary)
N/A
Generalelection
November 6, 2018
Poll closing(Eastern Time)
7pm & 8pm
Georgia
Georgia
State/territory
Georgia
Filingdeadline
March 9, 2018
Primaryelection
May 22, 2018
Primaryrunoff(if necessary)
July 24, 2018
Generalelection
November 6, 2018
Poll closing(Eastern Time)
7pm
Guam
Guam
State/territory
Guam
Filingdeadline
June 26, 2018
Primaryelection
August 25, 2018
Primaryrunoff(if necessary)
N/A
Generalelection
November 6, 2018
Poll closing(Eastern Time)
5am
Hawaii
Hawaii
State/territory
Hawaii
Filingdeadline
June 5, 2018
Primaryelection
August 11, 2018
Primaryrunoff(if necessary)
N/A
Generalelection
November 6, 2018
Poll closing(Eastern Time)
11pm
Idaho
Idaho
State/territory
Idaho
Filingdeadline
March 9, 2018
Primaryelection
May 15, 2018
Primaryrunoff(if necessary)
N/A
Generalelection
November 6, 2018
Poll closing(Eastern Time)
10pm & 11pm
Illinois
Illinois
State/territory
Illinois
Filingdeadline
December 4, 2017
Primaryelection
March 20, 2018
Primaryrunoff(if necessary)
N/A
Generalelection
November 6, 2018
Poll closing(Eastern Time)
8pm
Indiana
Indiana
State/territory
Indiana
Filingdeadline
February 9, 2018
Primaryelection
May 8, 2018
Primaryrunoff(if necessary)
N/A
Generalelection
November 6, 2018
Poll closing(Eastern Time)
6pm & 7pm
Iowa
Iowa
State/territory
Iowa
Filingdeadline
March 16, 2018
Primaryelection
June 5, 2018
Primaryrunoff(if necessary)
N/A
Generalelection
November 6, 2018
Poll closing(Eastern Time)
10pm
Kansas
Kansas
State/territory
Kansas
Filingdeadline
June 1, 2018
Primaryelection
August 7, 2018
Primaryrunoff(if necessary)
N/A
Generalelection
November 6, 2018
Poll closing(Eastern Time)
8pm & 9pm
Kentucky
Kentucky
State/territory
Kentucky
Filingdeadline
January 30, 2018
Primaryelection
May 22, 2018
Primaryrunoff(if necessary)
N/A
Generalelection
November 6, 2018
Poll closing(Eastern Time)
6pm & 7pm
Louisiana
Louisiana
State/territory
Louisiana
Filingdeadline
July 20, 2018
Primaryelection
November 6, 2018
Primaryrunoff(if necessary)
N/A
Generalelection
December 8, 2018
Poll closing(Eastern Time)
9pm
Maine
Maine
State/territory
Maine
Filingdeadline
March 15, 2018
Primaryelection
June 12, 2018
Primaryrunoff(if necessary)
N/A
Generalelection
November 6, 2018
Poll closing(Eastern Time)
8pm
Maryland
Maryland
State/territory
Maryland
Filingdeadline
February 27, 2018
Primaryelection
June 26, 2018
Primaryrunoff(if necessary)
N/A
Generalelection
November 6, 2018
Poll closing(Eastern Time)
8pm
Massachusetts
Massachusetts
State/territory
Massachusetts
Filingdeadline
June 5, 2018
Primaryelection
September 4, 2018
Primaryrunoff(if necessary)
N/A
Generalelection
November 6, 2018
Poll closing(Eastern Time)
8pm
Michigan
Michigan
State/territory
Michigan
Filingdeadline
April 24, 2018
Primaryelection
August 7, 2018
Primaryrunoff(if necessary)
N/A
Generalelection
November 6, 2018
Poll closing(Eastern Time)
8pm & 9pm
Minnesota
Minnesota
State/territory
Minnesota
Filingdeadline
June 5, 2018
Primaryelection
August 14, 2018
Primaryrunoff(if necessary)
N/A
Generalelection
November 6, 2018
Poll closing(Eastern Time)
9pm
Mississippi
Mississippi
State/territory
Mississippi
Filingdeadline
March 1, 2018
Primaryelection
June 5, 2018
Primaryrunoff(if necessary)
June 26, 2018
Generalelection
November 6, 2018
Poll closing(Eastern Time)
8pm
Missouri
Missouri
State/territory
Missouri
Filingdeadline
March 27, 2018
Primaryelection
August 7, 2018
Primaryrunoff(if necessary)
N/A
Generalelection
November 6, 2018
Poll closing(Eastern Time)
8pm
Montana
Montana
State/territory
Montana
Filingdeadline
March 12, 2018
Primaryelection
June 5, 2018
Primaryrunoff(if necessary)
N/A
Generalelection
November 6, 2018
Poll closing(Eastern Time)
10pm
Nebraska
Nebraska
State/territory
Nebraska
Filingdeadline
March 1, 2018
Primaryelection
May 15, 2018
Primaryrunoff(if necessary)
N/A
Generalelection
November 6, 2018
Poll closing(Eastern Time)
9pm
Nevada
Nevada
State/territory
Nevada
Filingdeadline
March 16, 2018
Primaryelection
June 12, 2018
Primaryrunoff(if necessary)
N/A
Generalelection
November 6, 2018
Poll closing(Eastern Time)
10pm
New Hampshire
New Hampshire
State/territory
New Hampshire
Filingdeadline
June 15, 2018
Primaryelection
September 11, 2018
Primaryrunoff(if necessary)
N/A
Generalelection
November 6, 2018
Poll closing(Eastern Time)
8pm
New Jersey
New Jersey
State/territory
New Jersey
Filingdeadline
April 2, 2018
Primaryelection
June 5, 2018
Primaryrunoff(if necessary)
N/A
Generalelection
November 6, 2018
Poll closing(Eastern Time)
8pm
New Mexico
New Mexico
State/territory
New Mexico
Filingdeadline
March 13, 2018
Primaryelection
June 5, 2018
Primaryrunoff(if necessary)
N/A
Generalelection
November 6, 2018
Poll closing(Eastern Time)
9pm
New York
New York
State/territory
New York
Filingdeadline
April 12, 2018
Primaryelection
June 26, 2018
Primaryrunoff(if necessary)
N/A
Generalelection
November 6, 2018
Poll closing(Eastern Time)
9pm
North Carolina
North Carolina
State/territory
North Carolina
Filingdeadline
February 28, 2018
Primaryelection
May 8, 2018
Primaryrunoff(if necessary)
July 17, 2018
Generalelection
November 6, 2018
Poll closing(Eastern Time)
7:30pm
North Dakota
North Dakota
State/territory
North Dakota
Filingdeadline
April 9, 2018
Primaryelection
June 12, 2018
Primaryrunoff(if necessary)
N/A
Generalelection
November 6, 2018
Poll closing(Eastern Time)
10pm & 11pm
Northern Mariana Islands
State/territory
Northern Mariana Islands
Filingdeadline
August 8, 2018
Primaryelection
N/A
Primaryrunoff(if necessary)
N/A
Generalelection
November 13, 2018
Poll closing(Eastern Time)
4am
Ohio
Ohio
State/territory
Ohio
Filingdeadline
February 7, 2018
Primaryelection
May 8, 2018
Primaryrunoff(if necessary)
N/A
Generalelection
November 6, 2018
Poll closing(Eastern Time)
7:30pm
Oklahoma
Oklahoma
State/territory
Oklahoma
Filingdeadline
April 13, 2018
Primaryelection
June 26, 2018
Primaryrunoff(if necessary)
August 28, 2018
Generalelection
November 6, 2018
Poll closing(Eastern Time)
8pm
Oregon
Oregon
State/territory
Oregon
Filingdeadline
March 6, 2018
Primaryelection
May 15, 2018
Primaryrunoff(if necessary)
N/A
Generalelection
November 6, 2018
Poll closing(Eastern Time)
10pm & 11pm
Pennsylvania
Pennsylvania
State/territory
Pennsylvania
Filingdeadline
March 20, 2018
Primaryelection
May 15, 2018
Primaryrunoff(if necessary)
N/A
Generalelection
November 6, 2018
Poll closing(Eastern Time)
8pm
Rhode Island
Rhode Island
State/territory
Rhode Island
Filingdeadline
June 27, 2018
Primaryelection
September 12, 2018
Primaryrunoff(if necessary)
N/A
Generalelection
November 6, 2018
Poll closing(Eastern Time)
8pm
South Carolina
South Carolina
State/territory
South Carolina
Filingdeadline
March 30, 2018
Primaryelection
June 12, 2018
Primaryrunoff(if necessary)
June 26, 2018
Generalelection
November 6, 2018
Poll closing(Eastern Time)
7pm
South Dakota
South Dakota
State/territory
South Dakota
Filingdeadline
March 27, 2018
Primaryelection
June 5, 2018
Primaryrunoff(if necessary)
August 14, 2018
Generalelection
November 6, 2018
Poll closing(Eastern Time)
8pm & 9pm
Tennessee
Tennessee
State/territory
Tennessee
Filingdeadline
April 5, 2018
Primaryelection
August 2, 2018
Primaryrunoff(if necessary)
N/A
Generalelection
November 6, 2018
Poll closing(Eastern Time)
8pm
Texas
Texas
State/territory
Texas
Filingdeadline
December 11, 2017
Primaryelection
March 6, 2018
Primaryrunoff(if necessary)
May 22, 2018
Generalelection
November 6, 2018
Poll closing(Eastern Time)
8pm & 9pm
United States Virgin Islands
State/territory
United States Virgin Islands
Filingdeadline
May 8, 2018
Primaryelection
August 4, 2018
Primaryrunoff(if necessary)
N/A
Generalelection
November 6, 2018
Poll closing(Eastern Time)
6pm
Utah
Utah
State/territory
Utah
Filingdeadline
March 15, 2018
Primaryelection
June 26, 2018
Primaryrunoff(if necessary)
N/A
Generalelection
November 6, 2018
Poll closing(Eastern Time)
10pm
Vermont
Vermont
State/territory
Vermont
Filingdeadline
May 31, 2018
Primaryelection
August 14, 2018
Primaryrunoff(if necessary)
N/A
Generalelection
November 6, 2018
Poll closing(Eastern Time)
7pm
Virginia
Virginia
State/territory
Virginia
Filingdeadline
March 29, 2018
Primaryelection
June 12, 2018
Primaryrunoff(if necessary)
N/A
Generalelection
November 6, 2018
Poll closing(Eastern Time)
7pm
Washington
Washington
State/territory
Washington
Filingdeadline
May 18, 2018
Primaryelection
August 7, 2018
Primaryrunoff(if necessary)
N/A
Generalelection
November 6, 2018
Poll closing(Eastern Time)
11pm
West Virginia
West Virginia
State/territory
West Virginia
Filingdeadline
January 27, 2018
Primaryelection
May 8, 2018
Primaryrunoff(if necessary)
N/A
Generalelection
November 6, 2018
Poll closing(Eastern Time)
7:30pm
Wisconsin
Wisconsin
State/territory
Wisconsin
Filingdeadline
June 1, 2018
Primaryelection
August 14, 2018
Primaryrunoff(if necessary)
N/A
Generalelection
November 6, 2018
Poll closing(Eastern Time)
9pm
Wyoming
Wyoming
State/territory
Wyoming
Filingdeadline
June 1, 2018
Primaryelection
August 21, 2018
Primaryrunoff(if necessary)
N/A
Generalelection
November 6, 2018
Poll closing(Eastern Time)
9pm
State/territory
Filingdeadline
Primaryelection
Primaryrunoff(if necessary)
Generalelection
Poll closing(Eastern Time)
Alabama
February 9, 2018
June 5, 2018
July 17, 2018
November 6, 2018
8pm
Alaska
June 1, 2018
August 21, 2018
N/A
November 6, 2018
Midnight & 1am
American Samoa
September 1, 2018
N/A
N/A
November 6, 2018
12am
Arizona
May 30, 2018
August 28, 2018
N/A
November 6, 2018
9pm
Arkansas
March 1, 2018
May 22, 2018
June 19, 2018
November 6, 2018
8:30pm
California
March 9, 2018
June 5, 2018
N/A
November 6, 2018
11pm
Colorado
March 20, 2018
June 26, 2018
N/A
November 6, 2018
9pm
Connecticut
June 12, 2018
August 14, 2018
N/A
November 6, 2018
8pm
Delaware
July 10, 2018
September 6, 2018
N/A
November 6, 2018
8pm
District of Columbia
March 21, 2018
June 19, 2018
N/A
November 6, 2018
8pm
Florida
May 4, 2018
August 28, 2018
N/A
November 6, 2018
7pm & 8pm
Georgia
March 9, 2018
May 22, 2018
July 24, 2018
November 6, 2018
7pm
Guam
June 26, 2018
August 25, 2018
N/A
November 6, 2018
5am
Hawaii
June 5, 2018
August 11, 2018
N/A
November 6, 2018
11pm
Idaho
March 9, 2018
May 15, 2018
N/A
November 6, 2018
10pm & 11pm
Illinois
December 4, 2017
March 20, 2018
N/A
November 6, 2018
8pm
Indiana
February 9, 2018
May 8, 2018
N/A
November 6, 2018
6pm & 7pm
Iowa
March 16, 2018
June 5, 2018
N/A
November 6, 2018
10pm
Kansas
June 1, 2018
August 7, 2018
N/A
November 6, 2018
8pm & 9pm
Kentucky
January 30, 2018
May 22, 2018
N/A
November 6, 2018
6pm & 7pm
Louisiana
July 20, 2018
November 6, 2018
N/A
December 8, 2018
9pm
Maine
March 15, 2018
June 12, 2018
N/A
November 6, 2018
8pm
Maryland
February 27, 2018
June 26, 2018
N/A
November 6, 2018
8pm
Massachusetts
June 5, 2018
September 4, 2018
N/A
November 6, 2018
8pm
Michigan
April 24, 2018
August 7, 2018
N/A
November 6, 2018
8pm & 9pm
Minnesota
June 5, 2018
August 14, 2018
N/A
November 6, 2018
9pm
Mississippi
March 1, 2018
June 5, 2018
June 26, 2018
November 6, 2018
8pm
Missouri
March 27, 2018
August 7, 2018
N/A
November 6, 2018
8pm
Montana
March 12, 2018
June 5, 2018
N/A
November 6, 2018
10pm
Nebraska
March 1, 2018
May 15, 2018
N/A
November 6, 2018
9pm
Nevada
March 16, 2018
June 12, 2018
N/A
November 6, 2018
10pm
New Hampshire
June 15, 2018
September 11, 2018
N/A
November 6, 2018
8pm
New Jersey
April 2, 2018
June 5, 2018
N/A
November 6, 2018
8pm
New Mexico
March 13, 2018
June 5, 2018
N/A
November 6, 2018
9pm
New York
April 12, 2018
June 26, 2018
N/A
November 6, 2018
9pm
North Carolina
February 28, 2018
May 8, 2018
July 17, 2018
November 6, 2018
7:30pm
North Dakota
April 9, 2018
June 12, 2018
N/A
November 6, 2018
10pm & 11pm
Northern Mariana Islands
August 8, 2018
N/A
N/A
November 13, 2018
4am
Ohio
February 7, 2018
May 8, 2018
N/A
November 6, 2018
7:30pm
Oklahoma
April 13, 2018
June 26, 2018
August 28, 2018
November 6, 2018
8pm
Oregon
March 6, 2018
May 15, 2018
N/A
November 6, 2018
10pm & 11pm
Pennsylvania
March 20, 2018
May 15, 2018
N/A
November 6, 2018
8pm
Rhode Island
June 27, 2018
September 12, 2018
N/A
November 6, 2018
8pm
South Carolina
March 30, 2018
June 12, 2018
June 26, 2018
November 6, 2018
7pm
South Dakota
March 27, 2018
June 5, 2018
August 14, 2018
November 6, 2018
8pm & 9pm
Tennessee
April 5, 2018
August 2, 2018
N/A
November 6, 2018
8pm
Texas
December 11, 2017
March 6, 2018
May 22, 2018
November 6, 2018
8pm & 9pm
United States Virgin Islands
May 8, 2018
August 4, 2018
N/A
November 6, 2018
6pm
Utah
March 15, 2018
June 26, 2018
N/A
November 6, 2018
10pm
· Alabama
Location
Location
District
Location
District
2017PVI
Incumbent
Representative
Incumbent
Party
Incumbent
Firstelected
Alabama 1
Alabama 1
District
Alabama 1
District
R+15
Incumbent
Bradley Byrne
Incumbent
Republican
Incumbent
2013 (special)
Results
Incumbent re-elected.
Candidates
▌Y Bradley Byrne (Republican) 63.2% ▌Robert Kennedy Jr. (Democratic) 36.8%
Alabama 2
Alabama 2
District
Alabama 2
District
R+16
Incumbent
Martha Roby
Incumbent
Republican
Incumbent
2010
Results
Incumbent re-elected.
Candidates
▌Y Martha Roby (Republican) 61.5% ▌Tabitha Isner (Democratic) 38.5%
Alabama 3
Alabama 3
District
Alabama 3
District
R+16
Incumbent
Mike D. Rogers
Incumbent
Republican
Incumbent
2002
Results
Incumbent re-elected.
Candidates
▌Y Mike D. Rogers (Republican) 63.8% ▌Mallory Hagan (Democratic) 36.2%
Alabama 4
Alabama 4
District
Alabama 4
District
R+30
Incumbent
Robert Aderholt
Incumbent
Republican
Incumbent
1996
Results
Incumbent re-elected.
Candidates
▌Y Robert Aderholt (Republican) 79.9% ▌Lee Auman (Democratic) 20.1%
Alabama 5
Alabama 5
District
Alabama 5
District
R+18
Incumbent
Mo Brooks
Incumbent
Republican
Incumbent
2010
Results
Incumbent re-elected.
Candidates
▌Y Mo Brooks (Republican) 61.1% ▌Peter Joffrion (Democratic) 38.9%
Alabama 6
Alabama 6
District
Alabama 6
District
R+26
Incumbent
Gary Palmer
Incumbent
Republican
Incumbent
2014
Results
Incumbent re-elected.
Candidates
▌Y Gary Palmer (Republican) 69.2% ▌Danner Kline (Democratic) 30.8%
Alabama 7
Alabama 7
District
Alabama 7
District
D+20
Incumbent
Terri Sewell
Incumbent
Democratic
Incumbent
2010
Results
Incumbent re-elected.
Candidates
▌Y Terri Sewell (Democratic) Unopposed
District
Incumbent
Results
Candidates
Location
2017PVI
Representative
Party
Firstelected
Alabama 1
R+15
Bradley Byrne
Republican
2013 (special)
Incumbent re-elected.
▌Y Bradley Byrne (Republican) 63.2% ▌Robert Kennedy Jr. (Democratic) 36.8%
Alabama 2
R+16
Martha Roby
Republican
2010
Incumbent re-elected.
▌Y Martha Roby (Republican) 61.5% ▌Tabitha Isner (Democratic) 38.5%
Alabama 3
R+16
Mike D. Rogers
Republican
2002
Incumbent re-elected.
▌Y Mike D. Rogers (Republican) 63.8% ▌Mallory Hagan (Democratic) 36.2%
Alabama 4
R+30
Robert Aderholt
Republican
1996
Incumbent re-elected.
▌Y Robert Aderholt (Republican) 79.9% ▌Lee Auman (Democratic) 20.1%
Alabama 5
R+18
Mo Brooks
Republican
2010
Incumbent re-elected.
▌Y Mo Brooks (Republican) 61.1% ▌Peter Joffrion (Democratic) 38.9%
Alabama 6
R+26
Gary Palmer
Republican
2014
Incumbent re-elected.
▌Y Gary Palmer (Republican) 69.2% ▌Danner Kline (Democratic) 30.8%
Alabama 7
D+20
Terri Sewell
Democratic
2010
Incumbent re-elected.
▌Y Terri Sewell (Democratic) Unopposed
· Alaska
Location
Location
District
Location
District
2017PVI
Incumbent
Representative
Incumbent
Party
Incumbent
Firstelected
Alaska at-large
Alaska at-large
District
Alaska at-large
District
R+9
Incumbent
Don Young
Incumbent
Republican
Incumbent
1973 (special)
Results
Incumbent re-elected.
Candidates
▌Y Don Young (Republican) 53.3% ▌Alyse Galvin (Undeclared/Democratic) 46.7%
District
Incumbent
Results
Candidates
Location
2017PVI
Representative
Party
Firstelected
Alaska at-large
R+9
Don Young
Republican
1973 (special)
Incumbent re-elected.
▌Y Don Young (Republican) 53.3% ▌Alyse Galvin (Undeclared/Democratic) 46.7%
· Arizona
Location
Location
District
Location
District
2017PVI
Incumbent
Representative
Incumbent
Party
Incumbent
Firstelected
Arizona 1
Arizona 1
District
Arizona 1
District
R+2
Incumbent
Tom O'Halleran
Incumbent
Democratic
Incumbent
2016
Results
Incumbent re-elected.
Candidates
▌Y Tom O'Halleran (Democratic) 53.8% ▌Wendy Rogers (Republican) 46.2%
Arizona 2
Arizona 2
District
Arizona 2
District
R+1
Incumbent
Martha McSally
Incumbent
Republican
Incumbent
2014
Results
Incumbent retired to run for U.S. Senator.Democratic gain.
Candidates
▌Y Ann Kirkpatrick (Democratic) 54.7% ▌Lea Marquez Peterson (Republican) 45.3%
Arizona 3
Arizona 3
District
Arizona 3
District
D+13
Incumbent
Raúl Grijalva
Incumbent
Democratic
Incumbent
2002
Results
Incumbent re-elected.
Candidates
▌Y Raúl Grijalva (Democratic) 63.9% ▌Nick Pierson (Republican) 36.1%
Arizona 4
Arizona 4
District
Arizona 4
District
R+21
Incumbent
Paul Gosar
Incumbent
Republican
Incumbent
2010
Results
Incumbent re-elected.
Candidates
▌Y Paul Gosar (Republican) 68.2% ▌David Brill (Democratic) 30.5% ▌Haryaksha Gregor Knauer (Green) 1.3%
Arizona 5
Arizona 5
District
Arizona 5
District
R+15
Incumbent
Andy Biggs
Incumbent
Republican
Incumbent
2016
Results
Incumbent re-elected.
Candidates
▌Y Andy Biggs (Republican) 59.4% ▌Joan Greene (Democratic) 40.6%
Arizona 6
Arizona 6
District
Arizona 6
District
R+9
Incumbent
David Schweikert
Incumbent
Republican
Incumbent
2010
Results
Incumbent re-elected.
Candidates
▌Y David Schweikert (Republican) 55.2% ▌Anita Malik (Democratic) 44.8%
Arizona 7
Arizona 7
District
Arizona 7
District
D+23
Incumbent
Ruben Gallego
Incumbent
Democratic
Incumbent
2014
Results
Incumbent re-elected.
Candidates
▌Y Ruben Gallego (Democratic) 85.8% ▌Gary Swing (Green) 14.2%
Arizona 8
Arizona 8
District
Arizona 8
District
R+13
Incumbent
Debbie Lesko
Incumbent
Republican
Incumbent
2018 (special)
Results
Incumbent re-elected.
Candidates
▌Y Debbie Lesko (Republican) 55.5% ▌Hiral Tipirneni (Democratic) 44.5%
Arizona 9
Arizona 9
District
Arizona 9
District
D+4
Incumbent
Kyrsten Sinema
Incumbent
Democratic
Incumbent
2012
Results
Incumbent retired to run for U.S. Senator.Democratic hold.
Candidates
▌Y Greg Stanton (Democratic) 61.1% ▌Steve Ferrara (Republican) 38.9%
District
Incumbent
Results
Candidates
Location
2017PVI
Representative
Party
Firstelected
Arizona 1
R+2
Tom O'Halleran
Democratic
2016
Incumbent re-elected.
▌Y Tom O'Halleran (Democratic) 53.8% ▌Wendy Rogers (Republican) 46.2%
Arizona 2
R+1
Martha McSally
Republican
2014
Incumbent retired to run for U.S. Senator.Democratic gain.
▌Y Ann Kirkpatrick (Democratic) 54.7% ▌Lea Marquez Peterson (Republican) 45.3%
Arizona 3
D+13
Raúl Grijalva
Democratic
2002
Incumbent re-elected.
▌Y Raúl Grijalva (Democratic) 63.9% ▌Nick Pierson (Republican) 36.1%
Arizona 4
R+21
Paul Gosar
Republican
2010
Incumbent re-elected.
▌Y Paul Gosar (Republican) 68.2% ▌David Brill (Democratic) 30.5% ▌Haryaksha Gregor Knauer (Green) 1.3%
Arizona 5
R+15
Andy Biggs
Republican
2016
Incumbent re-elected.
▌Y Andy Biggs (Republican) 59.4% ▌Joan Greene (Democratic) 40.6%
Arizona 6
R+9
David Schweikert
Republican
2010
Incumbent re-elected.
▌Y David Schweikert (Republican) 55.2% ▌Anita Malik (Democratic) 44.8%
Arizona 7
D+23
Ruben Gallego
Democratic
2014
Incumbent re-elected.
▌Y Ruben Gallego (Democratic) 85.8% ▌Gary Swing (Green) 14.2%
Arizona 8
R+13
Debbie Lesko
Republican
2018 (special)
Incumbent re-elected.
▌Y Debbie Lesko (Republican) 55.5% ▌Hiral Tipirneni (Democratic) 44.5%
Arizona 9
D+4
Kyrsten Sinema
Democratic
2012
Incumbent retired to run for U.S. Senator.Democratic hold.
▌Y Greg Stanton (Democratic) 61.1% ▌Steve Ferrara (Republican) 38.9%
· Arkansas
Location
Location
District
Location
District
2017PVI
Incumbent
Representative
Incumbent
Party
Incumbent
Firstelected
Arkansas 1
Arkansas 1
District
Arkansas 1
District
R+17
Incumbent
Rick Crawford
Incumbent
Republican
Incumbent
2010
Results
Incumbent re-elected.
Candidates
▌Y Rick Crawford (Republican) 68.9% ▌Chintan Desai (Democratic) 28.8% ▌Elvis Presley (Libertarian) 2.3%
Arkansas 2
Arkansas 2
District
Arkansas 2
District
R+7
Incumbent
French Hill
Incumbent
Republican
Incumbent
2014
Results
Incumbent re-elected.
Candidates
▌Y French Hill (Republican) 52.1% ▌Clarke Tucker (Democratic) 45.8% ▌Joe Ryne Swafford (Libertarian) 2.0%
Arkansas 3
Arkansas 3
District
Arkansas 3
District
R+19
Incumbent
Steve Womack
Incumbent
Republican
Incumbent
2010
Results
Incumbent re-elected.
Candidates
▌Y Steve Womack (Republican) 64.8% ▌Josh Mahony (Democratic) 32.6% ▌Michael Kalagias (Libertarian) 2.6%
Arkansas 4
Arkansas 4
District
Arkansas 4
District
R+17
Incumbent
Bruce Westerman
Incumbent
Republican
Incumbent
2014
Results
Incumbent re-elected.
Candidates
▌Y Bruce Westerman (Republican) 66.8% ▌Hayden Shamel (Democratic) 31.3% ▌Tom Canada (Libertarian) 1.9%
District
Incumbent
Results
Candidates
Location
2017PVI
Representative
Party
Firstelected
Arkansas 1
R+17
Rick Crawford
Republican
2010
Incumbent re-elected.
▌Y Rick Crawford (Republican) 68.9% ▌Chintan Desai (Democratic) 28.8% ▌Elvis Presley (Libertarian) 2.3%
Arkansas 2
R+7
French Hill
Republican
2014
Incumbent re-elected.
▌Y French Hill (Republican) 52.1% ▌Clarke Tucker (Democratic) 45.8% ▌Joe Ryne Swafford (Libertarian) 2.0%
Arkansas 3
R+19
Steve Womack
Republican
2010
Incumbent re-elected.
▌Y Steve Womack (Republican) 64.8% ▌Josh Mahony (Democratic) 32.6% ▌Michael Kalagias (Libertarian) 2.6%
Arkansas 4
R+17
Bruce Westerman
Republican
2014
Incumbent re-elected.
▌Y Bruce Westerman (Republican) 66.8% ▌Hayden Shamel (Democratic) 31.3% ▌Tom Canada (Libertarian) 1.9%
· California
Location
Location
District
Location
District
2017PVI
Incumbent
Representative
Incumbent
Party
Incumbent
Firstelected
California 1
California 1
District
California 1
District
R+11
Incumbent
Doug LaMalfa
Incumbent
Republican
Incumbent
2012
Results
Incumbent re-elected.
Candidates
▌Y Doug LaMalfa (Republican) 54.9% ▌Audrey Denney (Democratic) 45.1%
California 2
California 2
District
California 2
District
D+22
Incumbent
Jared Huffman
Incumbent
Democratic
Incumbent
2012
Results
Incumbent re-elected.
Candidates
▌Y Jared Huffman (Democratic) 77.0% ▌Dale Mensing (Republican) 23.0%
California 3
California 3
District
California 3
District
D+5
Incumbent
John Garamendi
Incumbent
Democratic
Incumbent
2009 (special)
Results
Incumbent re-elected.
Candidates
▌Y John Garamendi (Democratic) 58.1% ▌Charlie Schaupp (Republican) 41.9%
California 4
California 4
District
California 4
District
R+10
Incumbent
Tom McClintock
Incumbent
Republican
Incumbent
2008
Results
Incumbent re-elected.
Candidates
▌Y Tom McClintock (Republican) 54.1% ▌Jessica Morse (Democratic) 45.9%
California 5
California 5
District
California 5
District
D+21
Incumbent
Mike Thompson
Incumbent
Democratic
Incumbent
1998
Results
Incumbent re-elected.
Candidates
▌Y Mike Thompson (Democratic) 78.9% ▌Anthony Mills (Independent) 21.1%
California 6
California 6
District
California 6
District
D+21
Incumbent
Doris Matsui
Incumbent
Democratic
Incumbent
2005 (special)
Results
Incumbent re-elected.
Candidates
▌Y Doris Matsui (Democratic) 80.4% ▌Jrmar Jefferson (Democratic) 19.6%
California 7
California 7
District
California 7
District
D+3
Incumbent
Ami Bera
Incumbent
Democratic
Incumbent
2012
Results
Incumbent re-elected.
Candidates
▌Y Ami Bera (Democratic) 55.0% ▌Andrew Grant (Republican) 45.0%
California 8
California 8
District
California 8
District
R+9
Incumbent
Paul Cook
Incumbent
Republican
Incumbent
2012
Results
Incumbent re-elected.
Candidates
▌Y Paul Cook (Republican) 60.0% ▌Tim Donnelly (Republican) 40.0%
California 9
California 9
District
California 9
District
D+8
Incumbent
Jerry McNerney
Incumbent
Democratic
Incumbent
2006
Results
Incumbent re-elected.
Candidates
▌Y Jerry McNerney (Democratic) 56.5% ▌Marla Livengood (Republican) 43.5%
California 10
California 10
District
California 10
District
Even
Incumbent
Jeff Denham
Incumbent
Republican
Incumbent
2010
Results
Incumbent lost re-election.New member elected.Democratic gain.
Candidates
▌Y Josh Harder (Democratic) 52.3% ▌Jeff Denham (Republican) 47.7%
California 11
California 11
District
California 11
District
D+21
Incumbent
Mark DeSaulnier
Incumbent
Democratic
Incumbent
2014
Results
Incumbent re-elected.
Candidates
▌Y Mark DeSaulnier (Democratic) 74.1% ▌John Fitzgerald (Republican) 25.9%
California 12
California 12
District
California 12
District
D+37
Incumbent
Nancy Pelosi
Incumbent
Democratic
Incumbent
1987
Results
Incumbent re-elected.
Candidates
▌Y Nancy Pelosi (Democratic) 86.8% ▌Lisa Remmer (Republican) 13.2%
California 13
California 13
District
California 13
District
D+40
Incumbent
Barbara Lee
Incumbent
Democratic
Incumbent
1998 (special)
Results
Incumbent re-elected.
Candidates
▌Y Barbara Lee (Democratic) 88.4% ▌Laura Wells (Green) 11.6%
California 14
California 14
District
California 14
District
D+27
Incumbent
Jackie Speier
Incumbent
Democratic
Incumbent
2008 (special)
Results
Incumbent re-elected.
Candidates
▌Y Jackie Speier (Democratic) 79.2% ▌Cristina Osmeña (Republican) 20.8%
California 15
California 15
District
California 15
District
D+20
Incumbent
Eric Swalwell
Incumbent
Democratic
Incumbent
2012
Results
Incumbent re-elected.
Candidates
▌Y Eric Swalwell (Democratic) 73.0% ▌Rudy Peters (Republican) 27.0%
California 16
California 16
District
California 16
District
D+9
Incumbent
Jim Costa
Incumbent
Democratic
Incumbent
2004
Results
Incumbent re-elected.
Candidates
▌Y Jim Costa (Democratic) 57.5% ▌Elizabeth Heng (Republican) 42.5%
California 17
California 17
District
California 17
District
D+25
Incumbent
Ro Khanna
Incumbent
Democratic
Incumbent
2016
Results
Incumbent re-elected.
Candidates
▌Y Ro Khanna (Democratic) 75.3% ▌Ron Cohen (Republican) 24.7%
California 18
California 18
District
California 18
District
D+23
Incumbent
Anna Eshoo
Incumbent
Democratic
Incumbent
1992
Results
Incumbent re-elected.
Candidates
▌Y Anna Eshoo (Democratic) 74.5% ▌Christine Russell (Republican) 25.5%
California 19
California 19
District
California 19
District
D+24
Incumbent
Zoe Lofgren
Incumbent
Democratic
Incumbent
1994
Results
Incumbent re-elected.
Candidates
▌Y Zoe Lofgren (Democratic) 73.8% ▌Justin Aguilera (Republican) 26.2%
California 20
California 20
District
California 20
District
D+23
Incumbent
Jimmy Panetta
Incumbent
Democratic
Incumbent
2016
Results
Incumbent re-elected.
Candidates
▌Y Jimmy Panetta (Democratic) 81.4% ▌Ronald Kabat (Independent) 18.6%
California 21
California 21
District
California 21
District
D+5
Incumbent
David Valadao
Incumbent
Republican
Incumbent
2012
Results
Incumbent lost re-election.New member elected.Democratic gain.
Candidates
▌Y TJ Cox (Democratic) 50.4% ▌David Valadao (Republican) 49.6%
California 22
California 22
District
California 22
District
R+8
Incumbent
Devin Nunes
Incumbent
Republican
Incumbent
2002
Results
Incumbent re-elected.
Candidates
▌Y Devin Nunes (Republican) 52.7% ▌Andrew Janz (Democratic) 47.3%
California 23
California 23
District
California 23
District
R+14
Incumbent
Kevin McCarthy
Incumbent
Republican
Incumbent
2006
Results
Incumbent re-elected.
Candidates
▌Y Kevin McCarthy (Republican) 63.7% ▌Tatiana Matta (Democratic) 36.3%
California 24
California 24
District
California 24
District
D+7
Incumbent
Salud Carbajal
Incumbent
Democratic
Incumbent
2016
Results
Incumbent re-elected.
Candidates
▌Y Salud Carbajal (Democratic) 58.6% ▌Justin Fareed (Republican) 41.4%
California 25
California 25
District
California 25
District
Even
Incumbent
Steve Knight
Incumbent
Republican
Incumbent
2014
Results
Incumbent lost re-election.Democratic gain.
Candidates
▌Y Katie Hill (Democratic) 54.4% ▌Steve Knight (Republican) 45.6%
California 26
California 26
District
California 26
District
D+7
Incumbent
Julia Brownley
Incumbent
Democratic
Incumbent
2012
Results
Incumbent re-elected.
Candidates
▌Y Julia Brownley (Democratic) 61.9% ▌Antonio Sabàto Jr. (Republican) 38.1%
California 27
California 27
District
California 27
District
D+16
Incumbent
Judy Chu
Incumbent
Democratic
Incumbent
2009 (special)
Results
Incumbent re-elected.
Candidates
▌Y Judy Chu (Democratic) 79.2% ▌Bryan Witt (Democratic) 20.8%
California 28
California 28
District
California 28
District
D+23
Incumbent
Adam Schiff
Incumbent
Democratic
Incumbent
2000
Results
Incumbent re-elected.
Candidates
▌Y Adam Schiff (Democratic) 78.4% ▌Johnny Nalbandian (Republican) 21.6%
California 29
California 29
District
California 29
District
D+29
Incumbent
Tony Cárdenas
Incumbent
Democratic
Incumbent
2012
Results
Incumbent re-elected.
Candidates
▌Y Tony Cárdenas (Democratic) 80.6% ▌Benito Bernal (Republican) 19.4%
California 30
California 30
District
California 30
District
D+18
Incumbent
Brad Sherman
Incumbent
Democratic
Incumbent
1996
Results
Incumbent re-elected.
Candidates
▌Y Brad Sherman (Democratic) 73.4% ▌Mark Reed (Republican) 26.6%
California 31
California 31
District
California 31
District
D+8
Incumbent
Pete Aguilar
Incumbent
Democratic
Incumbent
2014
Results
Incumbent re-elected.
Candidates
▌Y Pete Aguilar (Democratic) 58.7% ▌Sean Flynn (Republican) 41.3%
California 32
California 32
District
California 32
District
D+17
Incumbent
Grace Napolitano
Incumbent
Democratic
Incumbent
1998
Results
Incumbent re-elected.
Candidates
▌Y Grace Napolitano (Democratic) 68.8% ▌Joshua Scott (Republican) 31.2%
California 33
California 33
District
California 33
District
D+16
Incumbent
Ted Lieu
Incumbent
Democratic
Incumbent
2014
Results
Incumbent re-elected.
Candidates
▌Y Ted Lieu (Democratic) 70.0% ▌Kenneth Wright (Republican) 30.0%
California 34
California 34
District
California 34
District
D+35
Incumbent
Jimmy Gomez
Incumbent
Democratic
Incumbent
2017 (special)
Results
Incumbent re-elected.
Candidates
▌Y Jimmy Gomez (Democratic) 72.5% ▌Kenneth Mejia (Green) 27.5%
California 35
California 35
District
California 35
District
D+19
Incumbent
Norma Torres
Incumbent
Democratic
Incumbent
2014
Results
Incumbent re-elected.
Candidates
▌Y Norma Torres (Democratic) 69.4% ▌Christian Valiente (Republican) 30.6%
California 36
California 36
District
California 36
District
D+2
Incumbent
Raul Ruiz
Incumbent
Democratic
Incumbent
2012
Results
Incumbent re-elected.
Candidates
▌Y Raul Ruiz (Democratic) 59.0% ▌Kimberlin Brown Pelzer (Republican) 41.0%
California 37
California 37
District
California 37
District
D+37
Incumbent
Karen Bass
Incumbent
Democratic
Incumbent
2010
Results
Incumbent re-elected.
Candidates
▌Y Karen Bass (Democratic) 89.1% ▌Ron Bassilian (Republican) 10.9%
California 38
California 38
District
California 38
District
D+17
Incumbent
Linda Sánchez
Incumbent
Democratic
Incumbent
2002
Results
Incumbent re-elected.
Candidates
▌Y Linda Sánchez (Democratic) 68.9% ▌Ryan Downing (Republican) 31.1%
California 39
California 39
District
California 39
District
Even
Incumbent
Ed Royce
Incumbent
Republican
Incumbent
1992
Results
Incumbent retired.New member elected.Democratic gain.
Candidates
▌Y Gil Cisneros (Democratic) 51.6% ▌Young Kim (Republican) 48.4%
California 40
California 40
District
California 40
District
D+33
Incumbent
Lucille Roybal-Allard
Incumbent
Democratic
Incumbent
1992
Results
Incumbent re-elected.
Candidates
▌Y Lucille Roybal-Allard (Democratic) 77.3% ▌Rodolfo Barragan (Green) 22.7%
California 41
California 41
District
California 41
District
D+12
Incumbent
Mark Takano
Incumbent
Democratic
Incumbent
2012
Results
Incumbent re-elected.
Candidates
▌Y Mark Takano (Democratic) 65.1% ▌Aja Smith (Republican) 34.9%
California 42
California 42
District
California 42
District
R+9
Incumbent
Ken Calvert
Incumbent
Republican
Incumbent
1992
Results
Incumbent re-elected.
Candidates
▌Y Ken Calvert (Republican) 56.5% ▌Julia Peacock (Democratic) 43.5%
California 43
California 43
District
California 43
District
D+29
Incumbent
Maxine Waters
Incumbent
Democratic
Incumbent
1990
Results
Incumbent re-elected.
Candidates
▌Y Maxine Waters (Democratic) 77.7% ▌Omar Navarro (Republican) 22.3%
California 44
California 44
District
California 44
District
D+35
Incumbent
Nanette Barragán
Incumbent
Democratic
Incumbent
2016
Results
Incumbent re-elected.
Candidates
▌Y Nanette Barragán (Democratic) 68.3% ▌Aja Brown (Democratic) 31.7%
California 45
California 45
District
California 45
District
R+3
Incumbent
Mimi Walters
Incumbent
Republican
Incumbent
2014
Results
Incumbent lost re-election.Democratic gain.
Candidates
▌Y Katie Porter (Democratic) 52.1% ▌Mimi Walters (Republican) 47.9%
California 46
California 46
District
California 46
District
D+15
Incumbent
Lou Correa
Incumbent
Democratic
Incumbent
2016
Results
Incumbent re-elected.
Candidates
▌Y Lou Correa (Democratic) 69.1% ▌Russell Lambert (Republican) 30.9%
California 47
California 47
District
California 47
District
D+13
Incumbent
Alan Lowenthal
Incumbent
Democratic
Incumbent
2012
Results
Incumbent re-elected.
Candidates
▌Y Alan Lowenthal (Democratic) 64.9% ▌John Briscoe (Republican) 35.1%
California 48
California 48
District
California 48
District
R+4
Incumbent
Dana Rohrabacher
Incumbent
Republican
Incumbent
1988
Results
Incumbent lost re-election.Democratic gain.
Candidates
▌Y Harley Rouda (Democratic) 53.6% ▌Dana Rohrabacher (Republican) 46.4%
California 49
California 49
District
California 49
District
R+1
Incumbent
Darrell Issa
Incumbent
Republican
Incumbent
2000
Results
Incumbent retired.Democratic gain.
Candidates
▌Y Mike Levin (Democratic) 56.4% ▌Diane Harkey (Republican) 43.6%
California 50
California 50
District
California 50
District
R+11
Incumbent
Duncan D. Hunter
Incumbent
Republican
Incumbent
2008
Results
Incumbent re-elected.
Candidates
▌Y Duncan D. Hunter (Republican) 51.7% ▌Ammar Campa-Najjar (Democratic) 48.3%
California 51
California 51
District
California 51
District
D+22
Incumbent
Juan Vargas
Incumbent
Democratic
Incumbent
2012
Results
Incumbent re-elected.
Candidates
▌Y Juan Vargas (Democratic) 71.2% ▌Juan Hidalgo (Republican) 28.8%
California 52
California 52
District
California 52
District
D+6
Incumbent
Scott Peters
Incumbent
Democratic
Incumbent
2012
Results
Incumbent re-elected.
Candidates
▌Y Scott Peters (Democratic) 63.8% ▌Omar Qudrat (Republican) 36.2%
California 53
California 53
District
California 53
District
D+14
Incumbent
Susan Davis
Incumbent
Democratic
Incumbent
2000
Results
Incumbent re-elected.
Candidates
▌Y Susan Davis (Democratic) 69.1% ▌Morgan Murtaugh (Republican) 30.9%
District
Incumbent
Results
Candidates
Location
2017PVI
Representative
Party
Firstelected
California 1
R+11
Doug LaMalfa
Republican
2012
Incumbent re-elected.
▌Y Doug LaMalfa (Republican) 54.9% ▌Audrey Denney (Democratic) 45.1%
California 2
D+22
Jared Huffman
Democratic
2012
Incumbent re-elected.
▌Y Jared Huffman (Democratic) 77.0% ▌Dale Mensing (Republican) 23.0%
California 3
D+5
John Garamendi
Democratic
2009 (special)
Incumbent re-elected.
▌Y John Garamendi (Democratic) 58.1% ▌Charlie Schaupp (Republican) 41.9%
California 4
R+10
Tom McClintock
Republican
2008
Incumbent re-elected.
▌Y Tom McClintock (Republican) 54.1% ▌Jessica Morse (Democratic) 45.9%
California 5
D+21
Mike Thompson
Democratic
1998
Incumbent re-elected.
▌Y Mike Thompson (Democratic) 78.9% ▌Anthony Mills (Independent) 21.1%
California 6
D+21
Doris Matsui
Democratic
2005 (special)
Incumbent re-elected.
▌Y Doris Matsui (Democratic) 80.4% ▌Jrmar Jefferson (Democratic) 19.6%
California 7
D+3
Ami Bera
Democratic
2012
Incumbent re-elected.
▌Y Ami Bera (Democratic) 55.0% ▌Andrew Grant (Republican) 45.0%
California 8
R+9
Paul Cook
Republican
2012
Incumbent re-elected.
▌Y Paul Cook (Republican) 60.0% ▌Tim Donnelly (Republican) 40.0%
California 9
D+8
Jerry McNerney
Democratic
2006
Incumbent re-elected.
▌Y Jerry McNerney (Democratic) 56.5% ▌Marla Livengood (Republican) 43.5%
California 10
Even
Jeff Denham
Republican
2010
Incumbent lost re-election.New member elected.Democratic gain.
▌Y Josh Harder (Democratic) 52.3% ▌Jeff Denham (Republican) 47.7%
California 11
D+21
Mark DeSaulnier
Democratic
2014
Incumbent re-elected.
▌Y Mark DeSaulnier (Democratic) 74.1% ▌John Fitzgerald (Republican) 25.9%
California 12
D+37
Nancy Pelosi
Democratic
1987
Incumbent re-elected.
▌Y Nancy Pelosi (Democratic) 86.8% ▌Lisa Remmer (Republican) 13.2%
California 13
D+40
Barbara Lee
Democratic
1998 (special)
Incumbent re-elected.
▌Y Barbara Lee (Democratic) 88.4% ▌Laura Wells (Green) 11.6%
California 14
D+27
Jackie Speier
Democratic
2008 (special)
Incumbent re-elected.
▌Y Jackie Speier (Democratic) 79.2% ▌Cristina Osmeña (Republican) 20.8%
California 15
D+20
Eric Swalwell
Democratic
2012
Incumbent re-elected.
▌Y Eric Swalwell (Democratic) 73.0% ▌Rudy Peters (Republican) 27.0%
California 16
D+9
Jim Costa
Democratic
2004
Incumbent re-elected.
▌Y Jim Costa (Democratic) 57.5% ▌Elizabeth Heng (Republican) 42.5%
California 17
D+25
Ro Khanna
Democratic
2016
Incumbent re-elected.
▌Y Ro Khanna (Democratic) 75.3% ▌Ron Cohen (Republican) 24.7%
California 18
D+23
Anna Eshoo
Democratic
1992
Incumbent re-elected.
▌Y Anna Eshoo (Democratic) 74.5% ▌Christine Russell (Republican) 25.5%
California 19
D+24
Zoe Lofgren
Democratic
1994
Incumbent re-elected.
▌Y Zoe Lofgren (Democratic) 73.8% ▌Justin Aguilera (Republican) 26.2%
California 20
D+23
Jimmy Panetta
Democratic
2016
Incumbent re-elected.
▌Y Jimmy Panetta (Democratic) 81.4% ▌Ronald Kabat (Independent) 18.6%
California 21
D+5
David Valadao
Republican
2012
Incumbent lost re-election.New member elected.Democratic gain.
▌Y TJ Cox (Democratic) 50.4% ▌David Valadao (Republican) 49.6%
California 22
R+8
Devin Nunes
Republican
2002
Incumbent re-elected.
▌Y Devin Nunes (Republican) 52.7% ▌Andrew Janz (Democratic) 47.3%
California 23
R+14
Kevin McCarthy
Republican
2006
Incumbent re-elected.
▌Y Kevin McCarthy (Republican) 63.7% ▌Tatiana Matta (Democratic) 36.3%
California 24
D+7
Salud Carbajal
Democratic
2016
Incumbent re-elected.
▌Y Salud Carbajal (Democratic) 58.6% ▌Justin Fareed (Republican) 41.4%
California 25
Even
Steve Knight
Republican
2014
Incumbent lost re-election.Democratic gain.
▌Y Katie Hill (Democratic) 54.4% ▌Steve Knight (Republican) 45.6%
California 26
D+7
Julia Brownley
Democratic
2012
Incumbent re-elected.
▌Y Julia Brownley (Democratic) 61.9% ▌Antonio Sabàto Jr. (Republican) 38.1%
California 27
D+16
Judy Chu
Democratic
2009 (special)
Incumbent re-elected.
▌Y Judy Chu (Democratic) 79.2% ▌Bryan Witt (Democratic) 20.8%
California 28
D+23
Adam Schiff
Democratic
2000
Incumbent re-elected.
▌Y Adam Schiff (Democratic) 78.4% ▌Johnny Nalbandian (Republican) 21.6%
California 29
D+29
Tony Cárdenas
Democratic
2012
Incumbent re-elected.
▌Y Tony Cárdenas (Democratic) 80.6% ▌Benito Bernal (Republican) 19.4%
California 30
D+18
Brad Sherman
Democratic
1996
Incumbent re-elected.
▌Y Brad Sherman (Democratic) 73.4% ▌Mark Reed (Republican) 26.6%
California 31
D+8
Pete Aguilar
Democratic
2014
Incumbent re-elected.
▌Y Pete Aguilar (Democratic) 58.7% ▌Sean Flynn (Republican) 41.3%
California 32
D+17
Grace Napolitano
Democratic
1998
Incumbent re-elected.
▌Y Grace Napolitano (Democratic) 68.8% ▌Joshua Scott (Republican) 31.2%
California 33
D+16
Ted Lieu
Democratic
2014
Incumbent re-elected.
▌Y Ted Lieu (Democratic) 70.0% ▌Kenneth Wright (Republican) 30.0%
California 34
D+35
Jimmy Gomez
Democratic
2017 (special)
Incumbent re-elected.
▌Y Jimmy Gomez (Democratic) 72.5% ▌Kenneth Mejia (Green) 27.5%
California 35
D+19
Norma Torres
Democratic
2014
Incumbent re-elected.
▌Y Norma Torres (Democratic) 69.4% ▌Christian Valiente (Republican) 30.6%
California 36
D+2
Raul Ruiz
Democratic
2012
Incumbent re-elected.
▌Y Raul Ruiz (Democratic) 59.0% ▌Kimberlin Brown Pelzer (Republican) 41.0%
California 37
D+37
Karen Bass
Democratic
2010
Incumbent re-elected.
▌Y Karen Bass (Democratic) 89.1% ▌Ron Bassilian (Republican) 10.9%
California 38
D+17
Linda Sánchez
Democratic
2002
Incumbent re-elected.
▌Y Linda Sánchez (Democratic) 68.9% ▌Ryan Downing (Republican) 31.1%
California 39
Even
Ed Royce
Republican
1992
Incumbent retired.New member elected.Democratic gain.
▌Y Gil Cisneros (Democratic) 51.6% ▌Young Kim (Republican) 48.4%
California 40
D+33
Lucille Roybal-Allard
Democratic
1992
Incumbent re-elected.
▌Y Lucille Roybal-Allard (Democratic) 77.3% ▌Rodolfo Barragan (Green) 22.7%
California 41
D+12
Mark Takano
Democratic
2012
Incumbent re-elected.
▌Y Mark Takano (Democratic) 65.1% ▌Aja Smith (Republican) 34.9%
California 42
R+9
Ken Calvert
Republican
1992
Incumbent re-elected.
▌Y Ken Calvert (Republican) 56.5% ▌Julia Peacock (Democratic) 43.5%
California 43
D+29
Maxine Waters
Democratic
1990
Incumbent re-elected.
▌Y Maxine Waters (Democratic) 77.7% ▌Omar Navarro (Republican) 22.3%
California 44
D+35
Nanette Barragán
Democratic
2016
Incumbent re-elected.
▌Y Nanette Barragán (Democratic) 68.3% ▌Aja Brown (Democratic) 31.7%
California 45
R+3
Mimi Walters
Republican
2014
Incumbent lost re-election.Democratic gain.
▌Y Katie Porter (Democratic) 52.1% ▌Mimi Walters (Republican) 47.9%
California 46
D+15
Lou Correa
Democratic
2016
Incumbent re-elected.
▌Y Lou Correa (Democratic) 69.1% ▌Russell Lambert (Republican) 30.9%
California 47
D+13
Alan Lowenthal
Democratic
2012
Incumbent re-elected.
▌Y Alan Lowenthal (Democratic) 64.9% ▌John Briscoe (Republican) 35.1%
California 48
R+4
Dana Rohrabacher
Republican
1988
Incumbent lost re-election.Democratic gain.
▌Y Harley Rouda (Democratic) 53.6% ▌Dana Rohrabacher (Republican) 46.4%
· Colorado
Location
Location
District
Location
District
2017PVI
Incumbent
Representative
Incumbent
Party
Incumbent
Firstelected
Colorado 1
Colorado 1
District
Colorado 1
District
D+21
Incumbent
Diana DeGette
Incumbent
Democratic
Incumbent
1996
Results
Incumbent re-elected.
Candidates
▌Y Diana DeGette (Democratic) 73.8% ▌Casper Stockham (Republican) 23.0%
Colorado 2
Colorado 2
District
Colorado 2
District
D+9
Incumbent
Jared Polis
Incumbent
Democratic
Incumbent
2008
Results
Incumbent retired to run for Governor of Colorado.Democratic hold.
Candidates
▌Y Joe Neguse (Democratic) 60.3% ▌Peter Yu (Republican) 33.6%
Colorado 3
Colorado 3
District
Colorado 3
District
R+6
Incumbent
Scott Tipton
Incumbent
Republican
Incumbent
2010
Results
Incumbent re-elected.
Candidates
▌Y Scott Tipton (Republican) 51.5% ▌Diane Mitsch Bush (Democratic) 43.6%
Colorado 4
Colorado 4
District
Colorado 4
District
R+13
Incumbent
Ken Buck
Incumbent
Republican
Incumbent
2014
Results
Incumbent re-elected.
Candidates
▌Y Ken Buck (Republican) 60.6% ▌Karen McCormick (Democratic) 39.4%
Colorado 5
Colorado 5
District
Colorado 5
District
R+14
Incumbent
Doug Lamborn
Incumbent
Republican
Incumbent
2006
Results
Incumbent re-elected.
Candidates
▌Y Doug Lamborn (Republican) 57.0% ▌Stephany Rose Spaulding (Democratic) 39.3%
Colorado 6
Colorado 6
District
Colorado 6
District
D+2
Incumbent
Mike Coffman
Incumbent
Republican
Incumbent
2008
Results
Incumbent lost re-election.Democratic gain.
Candidates
▌Y Jason Crow (Democratic) 54.1% ▌Mike Coffman (Republican) 42.9%
Colorado 7
Colorado 7
District
Colorado 7
District
D+6
Incumbent
Ed Perlmutter
Incumbent
Democratic
Incumbent
2006
Results
Incumbent re-elected.
Candidates
▌Y Ed Perlmutter (Democratic) 60.4% ▌Mark Barrington (Republican) 35.4%
District
Incumbent
Results
Candidates
Location
2017PVI
Representative
Party
Firstelected
Colorado 1
D+21
Diana DeGette
Democratic
1996
Incumbent re-elected.
▌Y Diana DeGette (Democratic) 73.8% ▌Casper Stockham (Republican) 23.0%
Colorado 2
D+9
Jared Polis
Democratic
2008
Incumbent retired to run for Governor of Colorado.Democratic hold.
▌Y Joe Neguse (Democratic) 60.3% ▌Peter Yu (Republican) 33.6%
Colorado 3
R+6
Scott Tipton
Republican
2010
Incumbent re-elected.
▌Y Scott Tipton (Republican) 51.5% ▌Diane Mitsch Bush (Democratic) 43.6%
Colorado 4
R+13
Ken Buck
Republican
2014
Incumbent re-elected.
▌Y Ken Buck (Republican) 60.6% ▌Karen McCormick (Democratic) 39.4%
Colorado 5
R+14
Doug Lamborn
Republican
2006
Incumbent re-elected.
▌Y Doug Lamborn (Republican) 57.0% ▌Stephany Rose Spaulding (Democratic) 39.3%
Colorado 6
D+2
Mike Coffman
Republican
2008
Incumbent lost re-election.Democratic gain.
▌Y Jason Crow (Democratic) 54.1% ▌Mike Coffman (Republican) 42.9%
Colorado 7
D+6
Ed Perlmutter
Democratic
2006
Incumbent re-elected.
▌Y Ed Perlmutter (Democratic) 60.4% ▌Mark Barrington (Republican) 35.4%
· Connecticut
Location
Location
District
Location
District
2017PVI
Incumbent
Representative
Incumbent
Party
Incumbent
Firstelected
Connecticut 1
Connecticut 1
District
Connecticut 1
District
D+12
Incumbent
John B. Larson
Incumbent
Democratic
Incumbent
1998
Results
Incumbent re-elected.
Candidates
▌Y John B. Larson (Democratic) 63.9% ▌Jennifer Nye (Republican) 35.0% ▌Thomas McCormick (Green) 1.1%
Connecticut 2
Connecticut 2
District
Connecticut 2
District
D+3
Incumbent
Joe Courtney
Incumbent
Democratic
Incumbent
2006
Results
Incumbent re-elected.
Candidates
▌Y Joe Courtney (Democratic) 62.2% ▌Danny Postemski (Republican) 35.4% ▌Michelle Bicking (Green) 1.2%
Connecticut 3
Connecticut 3
District
Connecticut 3
District
D+9
Incumbent
Rosa DeLauro
Incumbent
Democratic
Incumbent
1990
Results
Incumbent re-elected.
Candidates
▌Y Rosa DeLauro (Democratic) 64.6% ▌Angel Cadena (Republican) 35.4%
Connecticut 4
Connecticut 4
District
Connecticut 4
District
D+7
Incumbent
Jim Himes
Incumbent
Democratic
Incumbent
2008
Results
Incumbent re-elected.
Candidates
▌Y Jim Himes (Democratic) 61.2% ▌Harry Arora (Republican) 38.8%
Connecticut 5
Connecticut 5
District
Connecticut 5
District
D+2
Incumbent
Elizabeth Esty
Incumbent
Democratic
Incumbent
2012
Results
Incumbent retired.Democratic hold.
Candidates
▌Y Jahana Hayes (Democratic) 55.9% ▌Manny Santos (Republican) 44.1%
District
Incumbent
Results
Candidates
Location
2017PVI
Representative
Party
Firstelected
Connecticut 1
D+12
John B. Larson
Democratic
1998
Incumbent re-elected.
▌Y John B. Larson (Democratic) 63.9% ▌Jennifer Nye (Republican) 35.0% ▌Thomas McCormick (Green) 1.1%
Connecticut 2
D+3
Joe Courtney
Democratic
2006
Incumbent re-elected.
▌Y Joe Courtney (Democratic) 62.2% ▌Danny Postemski (Republican) 35.4% ▌Michelle Bicking (Green) 1.2%
Connecticut 3
D+9
Rosa DeLauro
Democratic
1990
Incumbent re-elected.
▌Y Rosa DeLauro (Democratic) 64.6% ▌Angel Cadena (Republican) 35.4%
Connecticut 4
D+7
Jim Himes
Democratic
2008
Incumbent re-elected.
▌Y Jim Himes (Democratic) 61.2% ▌Harry Arora (Republican) 38.8%
Connecticut 5
D+2
Elizabeth Esty
Democratic
2012
Incumbent retired.Democratic hold.
▌Y Jahana Hayes (Democratic) 55.9% ▌Manny Santos (Republican) 44.1%
· Delaware
Location
Location
District
Location
District
2017PVI
Incumbent
Representative
Incumbent
Party
Incumbent
Firstelected
Delaware at-large
Delaware at-large
District
Delaware at-large
District
D+6
Incumbent
Lisa Blunt Rochester
Incumbent
Democratic
Incumbent
2016
Results
Incumbent re-elected.
Candidates
▌Y Lisa Blunt Rochester (Democratic) 64.5% ▌Scott Walker (Republican) 35.5%
District
Incumbent
Results
Candidates
Location
2017PVI
Representative
Party
Firstelected
Delaware at-large
D+6
Lisa Blunt Rochester
Democratic
2016
Incumbent re-elected.
▌Y Lisa Blunt Rochester (Democratic) 64.5% ▌Scott Walker (Republican) 35.5%
· Florida
Location
Location
District
Location
District
2017PVI
Incumbent
Representative
Incumbent
Party
Incumbent
Firstelected
Florida 1
Florida 1
District
Florida 1
District
R+22
Incumbent
Matt Gaetz
Incumbent
Republican
Incumbent
2016
Results
Incumbent re-elected.
Candidates
▌Y Matt Gaetz (Republican) 67.1% ▌Jennifer Zimmerman (Democratic) 32.9%
Florida 2
Florida 2
District
Florida 2
District
R+18
Incumbent
Neal Dunn
Incumbent
Republican
Incumbent
2016
Results
Incumbent re-elected.
Candidates
▌Y Neal Dunn (Republican) 67.4% ▌Bob Rackleff (Democratic) 32.6%
Florida 3
Florida 3
District
Florida 3
District
R+9
Incumbent
Ted Yoho
Incumbent
Republican
Incumbent
2012
Results
Incumbent re-elected.
Candidates
▌Y Ted Yoho (Republican) 57.6% ▌Yvonne Hayes Hinson (Democratic) 42.4%
Florida 4
Florida 4
District
Florida 4
District
R+17
Incumbent
John Rutherford
Incumbent
Republican
Incumbent
2016
Results
Incumbent re-elected.
Candidates
▌Y John Rutherford (Republican) 65.2% ▌Ges Selmont (Democratic) 32.3% ▌Joceline Berrios (Independent) 1.9% ▌Jason Bulger (Independent) 0.6%
Florida 5
Florida 5
District
Florida 5
District
D+12
Incumbent
Al Lawson
Incumbent
Democratic
Incumbent
2016
Results
Incumbent re-elected.
Candidates
▌Y Al Lawson (Democratic) 66.8% ▌Virginia Fuller (Republican) 33.2%
Florida 6
Florida 6
District
Florida 6
District
R+7
Incumbent
Vacant
Incumbent
Rep. Ron DeSantis (R) resigned September 10, 2018, to run for Governor of Florida.Republican hold.
Incumbent
▌Y Mike Waltz (Republican) 56.3% ▌Nancy Soderberg (Democratic) 43.7%
Florida 7
Florida 7
District
Florida 7
District
Even
Incumbent
Stephanie Murphy
Incumbent
Democratic
Incumbent
2016
Results
Incumbent re-elected.
Candidates
▌Y Stephanie Murphy (Democratic) 57.7% ▌Mike Miller (Republican) 42.3%
Florida 8
Florida 8
District
Florida 8
District
R+11
Incumbent
Bill Posey
Incumbent
Republican
Incumbent
2008
Results
Incumbent re-elected.
Candidates
▌Y Bill Posey (Republican) 60.5% ▌Sanjay Patel (Democratic) 39.5%
Florida 9
Florida 9
District
Florida 9
District
D+5
Incumbent
Darren Soto
Incumbent
Democratic
Incumbent
2016
Results
Incumbent re-elected.
Candidates
▌Y Darren Soto (Democratic) 58.0% ▌Wayne Liebnitzky (Republican) 42.0%
Florida 10
Florida 10
District
Florida 10
District
D+11
Incumbent
Val Demings
Incumbent
Democratic
Incumbent
2016
Results
Incumbent re-elected.
Candidates
▌Y Val Demings (Democratic) Unopposed
Florida 11
Florida 11
District
Florida 11
District
R+15
Incumbent
Daniel Webster
Incumbent
Republican
Incumbent
2010
Results
Incumbent re-elected.
Candidates
▌Y Daniel Webster (Republican) 65.2% ▌Dana Cottrell (Democratic) 34.8%
Florida 12
Florida 12
District
Florida 12
District
R+8
Incumbent
Gus Bilirakis
Incumbent
Republican
Incumbent
2006
Results
Incumbent re-elected.
Candidates
▌Y Gus Bilirakis (Republican) 58.1% ▌Chris Hunter (Democratic) 39.7% ▌Angelika Purkis (Independent) 2.2%
Florida 13
Florida 13
District
Florida 13
District
D+2
Incumbent
Charlie Crist
Incumbent
Democratic
Incumbent
2016
Results
Incumbent re-elected.
Candidates
▌Y Charlie Crist (Democratic) 57.6% ▌George Buck (Republican) 42.4%
Florida 14
Florida 14
District
Florida 14
District
D+7
Incumbent
Kathy Castor
Incumbent
Democratic
Incumbent
2006
Results
Incumbent re-elected.
Candidates
▌Y Kathy Castor (Democratic) Unopposed
Florida 15
Florida 15
District
Florida 15
District
R+6
Incumbent
Dennis Ross
Incumbent
Republican
Incumbent
2010
Results
Incumbent retired.Republican hold.
Candidates
▌Y Ross Spano (Republican) 53.0% ▌Kristen Carlson (Democratic) 47.0%
Florida 16
Florida 16
District
Florida 16
District
R+7
Incumbent
Vern Buchanan
Incumbent
Republican
Incumbent
2006
Results
Incumbent re-elected.
Candidates
▌Y Vern Buchanan (Republican) 54.6% ▌David Shapiro (Democratic) 45.4%
Florida 17
Florida 17
District
Florida 17
District
R+13
Incumbent
Tom Rooney
Incumbent
Republican
Incumbent
2008
Results
Incumbent retired.Republican hold.
Candidates
▌Y Greg Steube (Republican) 62.3% ▌Allen Ellison (Democratic) 37.7%
Florida 18
Florida 18
District
Florida 18
District
R+5
Incumbent
Brian Mast
Incumbent
Republican
Incumbent
2016
Results
Incumbent re-elected.
Candidates
▌Y Brian Mast (Republican) 54.3% ▌Lauren Baer (Democratic) 45.7%
Florida 19
Florida 19
District
Florida 19
District
R+13
Incumbent
Francis Rooney
Incumbent
Republican
Incumbent
2016
Results
Incumbent re-elected.
Candidates
▌Y Francis Rooney (Republican) 62.3% ▌David Holden (Democratic) 37.7%
Florida 20
Florida 20
District
Florida 20
District
D+31
Incumbent
Alcee Hastings
Incumbent
Democratic
Incumbent
1992
Results
Incumbent re-elected.
Candidates
▌Y Alcee Hastings (Democratic) Unopposed
Florida 21
Florida 21
District
Florida 21
District
D+9
Incumbent
Lois Frankel
Incumbent
Democratic
Incumbent
2012
Results
Incumbent re-elected.
Candidates
▌Y Lois Frankel (Democratic) Unopposed
Florida 22
Florida 22
District
Florida 22
District
D+6
Incumbent
Ted Deutch
Incumbent
Democratic
Incumbent
2010 (special)
Results
Incumbent re-elected.
Candidates
▌Y Ted Deutch (Democratic) 62.0% ▌Nicolas Kimaz (Republican) 38.0%
Florida 23
Florida 23
District
Florida 23
District
D+11
Incumbent
Debbie Wasserman Schultz
Incumbent
Democratic
Incumbent
2004
Results
Incumbent re-elected.
Candidates
▌Y Debbie Wasserman Schultz (Democratic) 58.5% ▌Joseph Kaufman (Republican) 36.0% ▌Tim Canova (Independent) 5.0% ▌Don Endriss (Independent) 0.6%
Florida 24
Florida 24
District
Florida 24
District
D+34
Incumbent
Frederica Wilson
Incumbent
Democratic
Incumbent
2010
Results
Incumbent re-elected.
Candidates
▌Y Frederica Wilson (Democratic) Unopposed
Florida 25
Florida 25
District
Florida 25
District
R+4
Incumbent
Mario Díaz-Balart
Incumbent
Republican
Incumbent
2002
Results
Incumbent re-elected.
Candidates
▌Y Mario Díaz-Balart (Republican) 60.5% ▌Mary Barzee Flores (Democratic) 39.5%
Florida 26
Florida 26
District
Florida 26
District
D+6
Incumbent
Carlos Curbelo
Incumbent
Republican
Incumbent
2014
Results
Incumbent lost re-election.Democratic gain.
Candidates
▌Y Debbie Mucarsel-Powell (Democratic) 50.9% ▌Carlos Curbelo (Republican) 49.1%
Florida 27
Florida 27
District
Florida 27
District
D+5
Incumbent
Ileana Ros-Lehtinen
Incumbent
Republican
Incumbent
1989
Results
Incumbent retired.Democratic gain.
Candidates
▌Y Donna Shalala (Democratic) 51.8% ▌María Elvira Salazar (Republican) 45.8% ▌Mayra Joli (Independent) 2.5%
District
Incumbent
Results
Candidates
Location
2017PVI
Representative
Party
Firstelected
Florida 1
R+22
Matt Gaetz
Republican
2016
Incumbent re-elected.
▌Y Matt Gaetz (Republican) 67.1% ▌Jennifer Zimmerman (Democratic) 32.9%
Florida 2
R+18
Neal Dunn
Republican
2016
Incumbent re-elected.
▌Y Neal Dunn (Republican) 67.4% ▌Bob Rackleff (Democratic) 32.6%
Florida 3
R+9
Ted Yoho
Republican
2012
Incumbent re-elected.
▌Y Ted Yoho (Republican) 57.6% ▌Yvonne Hayes Hinson (Democratic) 42.4%
Florida 4
R+17
John Rutherford
Republican
2016
Incumbent re-elected.
▌Y John Rutherford (Republican) 65.2% ▌Ges Selmont (Democratic) 32.3% ▌Joceline Berrios (Independent) 1.9% ▌Jason Bulger (Independent) 0.6%
Florida 5
D+12
Al Lawson
Democratic
2016
Incumbent re-elected.
▌Y Al Lawson (Democratic) 66.8% ▌Virginia Fuller (Republican) 33.2%
Florida 6
R+7
Vacant
Rep. Ron DeSantis (R) resigned September 10, 2018, to run for Governor of Florida.Republican hold.
▌Y Mike Waltz (Republican) 56.3% ▌Nancy Soderberg (Democratic) 43.7%
Florida 7
Even
Stephanie Murphy
Democratic
2016
Incumbent re-elected.
▌Y Stephanie Murphy (Democratic) 57.7% ▌Mike Miller (Republican) 42.3%
Florida 8
R+11
Bill Posey
Republican
2008
Incumbent re-elected.
▌Y Bill Posey (Republican) 60.5% ▌Sanjay Patel (Democratic) 39.5%
Florida 9
D+5
Darren Soto
Democratic
2016
Incumbent re-elected.
▌Y Darren Soto (Democratic) 58.0% ▌Wayne Liebnitzky (Republican) 42.0%
Florida 10
D+11
Val Demings
Democratic
2016
Incumbent re-elected.
▌Y Val Demings (Democratic) Unopposed
Florida 11
R+15
Daniel Webster
Republican
2010
Incumbent re-elected.
▌Y Daniel Webster (Republican) 65.2% ▌Dana Cottrell (Democratic) 34.8%
Florida 12
R+8
Gus Bilirakis
Republican
2006
Incumbent re-elected.
▌Y Gus Bilirakis (Republican) 58.1% ▌Chris Hunter (Democratic) 39.7% ▌Angelika Purkis (Independent) 2.2%
Florida 13
D+2
Charlie Crist
Democratic
2016
Incumbent re-elected.
▌Y Charlie Crist (Democratic) 57.6% ▌George Buck (Republican) 42.4%
Florida 14
D+7
Kathy Castor
Democratic
2006
Incumbent re-elected.
▌Y Kathy Castor (Democratic) Unopposed
Florida 15
R+6
Dennis Ross
Republican
2010
Incumbent retired.Republican hold.
▌Y Ross Spano (Republican) 53.0% ▌Kristen Carlson (Democratic) 47.0%
Florida 16
R+7
Vern Buchanan
Republican
2006
Incumbent re-elected.
▌Y Vern Buchanan (Republican) 54.6% ▌David Shapiro (Democratic) 45.4%
Florida 17
R+13
Tom Rooney
Republican
2008
Incumbent retired.Republican hold.
▌Y Greg Steube (Republican) 62.3% ▌Allen Ellison (Democratic) 37.7%
Florida 18
R+5
Brian Mast
Republican
2016
Incumbent re-elected.
▌Y Brian Mast (Republican) 54.3% ▌Lauren Baer (Democratic) 45.7%
Florida 19
R+13
Francis Rooney
Republican
2016
Incumbent re-elected.
▌Y Francis Rooney (Republican) 62.3% ▌David Holden (Democratic) 37.7%
Florida 20
D+31
Alcee Hastings
Democratic
1992
Incumbent re-elected.
▌Y Alcee Hastings (Democratic) Unopposed
Florida 21
D+9
Lois Frankel
Democratic
2012
Incumbent re-elected.
▌Y Lois Frankel (Democratic) Unopposed
Florida 22
D+6
Ted Deutch
Democratic
2010 (special)
Incumbent re-elected.
▌Y Ted Deutch (Democratic) 62.0% ▌Nicolas Kimaz (Republican) 38.0%
Florida 23
D+11
Debbie Wasserman Schultz
Democratic
2004
Incumbent re-elected.
▌Y Debbie Wasserman Schultz (Democratic) 58.5% ▌Joseph Kaufman (Republican) 36.0% ▌Tim Canova (Independent) 5.0% ▌Don Endriss (Independent) 0.6%
Florida 24
D+34
Frederica Wilson
Democratic
2010
Incumbent re-elected.
▌Y Frederica Wilson (Democratic) Unopposed
Florida 25
R+4
Mario Díaz-Balart
Republican
2002
Incumbent re-elected.
▌Y Mario Díaz-Balart (Republican) 60.5% ▌Mary Barzee Flores (Democratic) 39.5%
Florida 26
D+6
Carlos Curbelo
Republican
2014
Incumbent lost re-election.Democratic gain.
▌Y Debbie Mucarsel-Powell (Democratic) 50.9% ▌Carlos Curbelo (Republican) 49.1%
Florida 27
D+5
Ileana Ros-Lehtinen
Republican
1989
Incumbent retired.Democratic gain.
▌Y Donna Shalala (Democratic) 51.8% ▌María Elvira Salazar (Republican) 45.8% ▌Mayra Joli (Independent) 2.5%
· Georgia
Location
Location
District
Location
District
2017PVI
Incumbent
Representative
Incumbent
Party
Incumbent
Firstelected
Georgia 1
Georgia 1
District
Georgia 1
District
R+9
Incumbent
Buddy Carter
Incumbent
Republican
Incumbent
2014
Results
Incumbent re-elected.
Candidates
▌Y Buddy Carter (Republican) 57.7% ▌Lisa Ring (Democratic) 42.3%
Georgia 2
Georgia 2
District
Georgia 2
District
D+6
Incumbent
Sanford Bishop
Incumbent
Democratic
Incumbent
1992
Results
Incumbent re-elected.
Candidates
▌Y Sanford Bishop (Democratic) 59.6% ▌Herman West (Republican) 40.4%
Georgia 3
Georgia 3
District
Georgia 3
District
R+18
Incumbent
Drew Ferguson
Incumbent
Republican
Incumbent
2016
Results
Incumbent re-elected.
Candidates
▌Y Drew Ferguson (Republican) 65.5% ▌Chuck Enderlin (Democratic) 34.5%
Georgia 4
Georgia 4
District
Georgia 4
District
D+24
Incumbent
Hank Johnson
Incumbent
Democratic
Incumbent
2006
Results
Incumbent re-elected.
Candidates
▌Y Hank Johnson (Democratic) 78.8% ▌Joe Profit (Republican) 21.2%
Georgia 5
Georgia 5
District
Georgia 5
District
D+34
Incumbent
John Lewis
Incumbent
Democratic
Incumbent
1986
Results
Incumbent re-elected.
Candidates
▌Y John Lewis (Democratic) 100%
Georgia 6
Georgia 6
District
Georgia 6
District
R+8
Incumbent
Karen Handel
Incumbent
Republican
Incumbent
2017 (special)
Results
Incumbent lost re-election.Democratic gain.
Candidates
▌Y Lucy McBath (Democratic) 50.5% ▌Karen Handel (Republican) 49.5%
Georgia 7
Georgia 7
District
Georgia 7
District
R+9
Incumbent
Rob Woodall
Incumbent
Republican
Incumbent
2010
Results
Incumbent re-elected.
Candidates
▌Y Rob Woodall (Republican) 50.07% ▌Carolyn Bourdeaux (Democratic) 49.93%
Georgia 8
Georgia 8
District
Georgia 8
District
R+15
Incumbent
Austin Scott
Incumbent
Republican
Incumbent
2010
Results
Incumbent re-elected.
Candidates
▌Y Austin Scott (Republican) 99.7%
Georgia 9
Georgia 9
District
Georgia 9
District
R+31
Incumbent
Doug Collins
Incumbent
Republican
Incumbent
2012
Results
Incumbent re-elected.
Candidates
▌Y Doug Collins (Republican) 79.5% ▌Josh McCall (Democratic) 20.5%
Georgia 10
Georgia 10
District
Georgia 10
District
R+15
Incumbent
Jody Hice
Incumbent
Republican
Incumbent
2014
Results
Incumbent re-elected.
Candidates
▌Y Jody Hice (Republican) 62.9% ▌Tabitha Johnson-Green (Democratic) 37.1%
Georgia 11
Georgia 11
District
Georgia 11
District
R+17
Incumbent
Barry Loudermilk
Incumbent
Republican
Incumbent
2014
Results
Incumbent re-elected.
Candidates
▌Y Barry Loudermilk (Republican) 61.8% ▌Flynn Broady (Democratic) 38.2%
Georgia 12
Georgia 12
District
Georgia 12
District
R+9
Incumbent
Rick Allen
Incumbent
Republican
Incumbent
2014
Results
Incumbent re-elected.
Candidates
▌Y Rick Allen (Republican) 59.5% ▌Francys Johnson (Democratic) 40.5%
Georgia 13
Georgia 13
District
Georgia 13
District
D+20
Incumbent
David Scott
Incumbent
Democratic
Incumbent
2002
Results
Incumbent re-elected.
Candidates
▌Y David Scott (Democratic) 76.2% ▌David Callahan (Republican) 23.8%
Georgia 14
Georgia 14
District
Georgia 14
District
R+27
Incumbent
Tom Graves
Incumbent
Republican
Incumbent
2010 (special)
Results
Incumbent re-elected.
Candidates
▌Y Tom Graves (Republican) 76.5% ▌Steve Foster (Democratic) 23.5%
District
Incumbent
Results
Candidates
Location
2017PVI
Representative
Party
Firstelected
Georgia 1
R+9
Buddy Carter
Republican
2014
Incumbent re-elected.
▌Y Buddy Carter (Republican) 57.7% ▌Lisa Ring (Democratic) 42.3%
Georgia 2
D+6
Sanford Bishop
Democratic
1992
Incumbent re-elected.
▌Y Sanford Bishop (Democratic) 59.6% ▌Herman West (Republican) 40.4%
Georgia 3
R+18
Drew Ferguson
Republican
2016
Incumbent re-elected.
▌Y Drew Ferguson (Republican) 65.5% ▌Chuck Enderlin (Democratic) 34.5%
Georgia 4
D+24
Hank Johnson
Democratic
2006
Incumbent re-elected.
▌Y Hank Johnson (Democratic) 78.8% ▌Joe Profit (Republican) 21.2%
Georgia 5
D+34
John Lewis
Democratic
1986
Incumbent re-elected.
▌Y John Lewis (Democratic) 100%
Georgia 6
R+8
Karen Handel
Republican
2017 (special)
Incumbent lost re-election.Democratic gain.
▌Y Lucy McBath (Democratic) 50.5% ▌Karen Handel (Republican) 49.5%
Georgia 7
R+9
Rob Woodall
Republican
2010
Incumbent re-elected.
▌Y Rob Woodall (Republican) 50.07% ▌Carolyn Bourdeaux (Democratic) 49.93%
Georgia 8
R+15
Austin Scott
Republican
2010
Incumbent re-elected.
▌Y Austin Scott (Republican) 99.7%
Georgia 9
R+31
Doug Collins
Republican
2012
Incumbent re-elected.
▌Y Doug Collins (Republican) 79.5% ▌Josh McCall (Democratic) 20.5%
Georgia 10
R+15
Jody Hice
Republican
2014
Incumbent re-elected.
▌Y Jody Hice (Republican) 62.9% ▌Tabitha Johnson-Green (Democratic) 37.1%
Georgia 11
R+17
Barry Loudermilk
Republican
2014
Incumbent re-elected.
▌Y Barry Loudermilk (Republican) 61.8% ▌Flynn Broady (Democratic) 38.2%
Georgia 12
R+9
Rick Allen
Republican
2014
Incumbent re-elected.
▌Y Rick Allen (Republican) 59.5% ▌Francys Johnson (Democratic) 40.5%
Georgia 13
D+20
David Scott
Democratic
2002
Incumbent re-elected.
▌Y David Scott (Democratic) 76.2% ▌David Callahan (Republican) 23.8%
Georgia 14
R+27
Tom Graves
Republican
2010 (special)
Incumbent re-elected.
▌Y Tom Graves (Republican) 76.5% ▌Steve Foster (Democratic) 23.5%
· Hawaii
Location
Location
District
Location
District
2017PVI
Incumbent
Representative
Incumbent
Party
Incumbent
Firstelected
Hawaii 1
Hawaii 1
District
Hawaii 1
District
D+17
Incumbent
Colleen Hanabusa
Incumbent
Democratic
Incumbent
20102014 (retired)2016
Results
Incumbent retired to run for Governor of Hawaii.Democratic hold.
Candidates
▌Y Ed Case (Democratic) 73.1% ▌Cam Cavasso (Republican) 23.1% ▌Michelle Tippens (Libertarian) 1.9% ▌Zachary Burd (Green) 1.2% ▌Calvin Griffin (Nonpartisan) 0.7%
Hawaii 2
Hawaii 2
District
Hawaii 2
District
D+19
Incumbent
Tulsi Gabbard
Incumbent
Democratic
Incumbent
2012
Results
Incumbent re-elected.
Candidates
▌Y Tulsi Gabbard (Democratic) 77.4% ▌Brian Evans (Republican) 22.6%
District
Incumbent
Results
Candidates
Location
2017PVI
Representative
Party
Firstelected
Hawaii 1
D+17
Colleen Hanabusa
Democratic
20102014 (retired)2016
Incumbent retired to run for Governor of Hawaii.Democratic hold.
▌Y Ed Case (Democratic) 73.1% ▌Cam Cavasso (Republican) 23.1% ▌Michelle Tippens (Libertarian) 1.9% ▌Zachary Burd (Green) 1.2% ▌Calvin Griffin (Nonpartisan) 0.7%
Hawaii 2
D+19
Tulsi Gabbard
Democratic
2012
Incumbent re-elected.
▌Y Tulsi Gabbard (Democratic) 77.4% ▌Brian Evans (Republican) 22.6%
· Idaho
Location
Location
District
Location
District
2017PVI
Incumbent
Representative
Incumbent
Party
Incumbent
Firstelected
Idaho 1
Idaho 1
District
Idaho 1
District
R+21
Incumbent
Raúl Labrador
Incumbent
Republican
Incumbent
2010
Results
Incumbent retired to run for Governor of Idaho.Republican hold.
Candidates
▌Y Russ Fulcher (Republican) 62.8% ▌Cristina McNeil (Democratic) 30.8% ▌Natalie Fleming (Independent) 2.0% ▌W. Scott Howard (Libertarian) 1.7% ▌Paul Farmer (Independent) 1.4% ▌Pro-Life (Constitution) 1.0% ▌Gordon Counsil (Independent) 0.3%
Idaho 2
Idaho 2
District
Idaho 2
District
R+17
Incumbent
Mike Simpson
Incumbent
Republican
Incumbent
1998
Results
Incumbent re-elected.
Candidates
▌Y Mike Simpson (Republican) 60.7% ▌Aaron Swisher (Democratic) 39.3%
District
Incumbent
Results
Candidates
Location
2017PVI
Representative
Party
Firstelected
Idaho 1
R+21
Raúl Labrador
Republican
2010
Incumbent retired to run for Governor of Idaho.Republican hold.
▌Y Russ Fulcher (Republican) 62.8% ▌Cristina McNeil (Democratic) 30.8% ▌Natalie Fleming (Independent) 2.0% ▌W. Scott Howard (Libertarian) 1.7% ▌Paul Farmer (Independent) 1.4% ▌Pro-Life (Constitution) 1.0% ▌Gordon Counsil (Independent) 0.3%
Idaho 2
R+17
Mike Simpson
Republican
1998
Incumbent re-elected.
▌Y Mike Simpson (Republican) 60.7% ▌Aaron Swisher (Democratic) 39.3%
· Illinois
Location
Location
District
Location
District
2017PVI
Incumbent
Representative
Incumbent
Party
Incumbent
Firstelected
Illinois 1
Illinois 1
District
Illinois 1
District
D+27
Incumbent
Bobby Rush
Incumbent
Democratic
Incumbent
1992
Results
Incumbent re-elected.
Candidates
▌Y Bobby Rush (Democratic) 73.5% ▌Jimmy Tillman (Republican) 19.8%
Illinois 2
Illinois 2
District
Illinois 2
District
D+29
Incumbent
Robin Kelly
Incumbent
Democratic
Incumbent
2013 (special)
Results
Incumbent re-elected.
Candidates
▌Y Robin Kelly (Democratic) 81.1% ▌David Merkle (Republican) 18.9%
Illinois 3
Illinois 3
District
Illinois 3
District
D+6
Incumbent
Dan Lipinski
Incumbent
Democratic
Incumbent
2004
Results
Incumbent re-elected.
Candidates
▌Y Dan Lipinski (Democratic) 73.8% ▌Arthur Jones (Republican) 26.2%
Illinois 4
Illinois 4
District
Illinois 4
District
D+33
Incumbent
Luis Gutiérrez
Incumbent
Democratic
Incumbent
1992
Results
Incumbent retired.Democratic hold.
Candidates
▌Y Chuy García (Democratic) 86.6% ▌Mark Lorch (Republican) 13.4%
Illinois 5
Illinois 5
District
Illinois 5
District
D+20
Incumbent
Mike Quigley
Incumbent
Democratic
Incumbent
2009 (special)
Results
Incumbent re-elected.
Candidates
▌Y Mike Quigley (Democratic) 76.7% ▌Tom Hanson (Republican) 23.3%
Illinois 6
Illinois 6
District
Illinois 6
District
R+2
Incumbent
Peter Roskam
Incumbent
Republican
Incumbent
2006
Results
Incumbent lost re-election.Democratic gain.
Candidates
▌Y Sean Casten (Democratic) 53.6% ▌Peter Roskam (Republican) 46.4%
Illinois 7
Illinois 7
District
Illinois 7
District
D+38
Incumbent
Danny Davis
Incumbent
Democratic
Incumbent
1996
Results
Incumbent re-elected.
Candidates
▌Y Danny Davis (Democratic) 87.6% ▌Craig Cameron (Republican) 12.4%
Illinois 8
Illinois 8
District
Illinois 8
District
D+8
Incumbent
Raja Krishnamoorthi
Incumbent
Democratic
Incumbent
2016
Results
Incumbent re-elected.
Candidates
▌Y Raja Krishnamoorthi (Democratic) 66.0% ▌J. D. Diganvker (Republican) 34.0%
Illinois 9
Illinois 9
District
Illinois 9
District
D+18
Incumbent
Jan Schakowsky
Incumbent
Democratic
Incumbent
1998
Results
Incumbent re-elected.
Candidates
▌Y Jan Schakowsky (Democratic) 73.5% ▌John Elleson (Republican) 26.5%
Illinois 10
Illinois 10
District
Illinois 10
District
D+10
Incumbent
Brad Schneider
Incumbent
Democratic
Incumbent
20122014 (defeated)2016
Results
Incumbent re-elected.
Candidates
▌Y Brad Schneider (Democratic) 65.6% ▌Douglas Bennett (Republican) 34.4%
Illinois 11
Illinois 11
District
Illinois 11
District
D+9
Incumbent
Bill Foster
Incumbent
Democratic
Incumbent
2008 (special)2010 (defeated)2012
Results
Incumbent re-elected.
Candidates
▌Y Bill Foster (Democratic) 63.8% ▌Nick Stella (Republican) 36.2%
Illinois 12
Illinois 12
District
Illinois 12
District
R+5
Incumbent
Mike Bost
Incumbent
Republican
Incumbent
2014
Results
Incumbent re-elected.
Candidates
▌Y Mike Bost (Republican) 51.6% ▌Brendan Kelly (Democratic) 45.4% ▌Randall Auxier (Green) 3.0%
Illinois 13
Illinois 13
District
Illinois 13
District
R+3
Incumbent
Rodney Davis
Incumbent
Republican
Incumbent
2012
Results
Incumbent re-elected.
Candidates
▌Y Rodney Davis (Republican) 50.4% ▌Betsy Dirksen Londrigan (Democratic) 49.6%
Illinois 14
Illinois 14
District
Illinois 14
District
R+5
Incumbent
Randy Hultgren
Incumbent
Republican
Incumbent
2010
Results
Incumbent lost re-election.Democratic gain.
Candidates
▌Y Lauren Underwood (Democratic) 52.5% ▌Randy Hultgren (Republican) 47.5%
Illinois 15
Illinois 15
District
Illinois 15
District
R+21
Incumbent
John Shimkus
Incumbent
Republican
Incumbent
1996
Results
Incumbent re-elected.
Candidates
▌Y John Shimkus (Republican) 70.9% ▌Kevin Gaither (Democratic) 29.1%
Illinois 16
Illinois 16
District
Illinois 16
District
R+8
Incumbent
Adam Kinzinger
Incumbent
Republican
Incumbent
2010
Results
Incumbent re-elected.
Candidates
▌Y Adam Kinzinger (Republican) 59.1% ▌Sara Dady (Democratic) 40.9%
Illinois 17
Illinois 17
District
Illinois 17
District
D+3
Incumbent
Cheri Bustos
Incumbent
Democratic
Incumbent
2012
Results
Incumbent re-elected.
Candidates
▌Y Cheri Bustos (Democratic) 62.1% ▌Bill Fawell (Republican) 37.9%
Illinois 18
Illinois 18
District
Illinois 18
District
R+15
Incumbent
Darin LaHood
Incumbent
Republican
Incumbent
2015 (special)
Results
Incumbent re-elected.
Candidates
▌Y Darin LaHood (Republican) 67.2% ▌Junius Rodriguez (Democratic) 32.8%
District
Incumbent
Results
Candidates
Location
2017PVI
Representative
Party
Firstelected
Illinois 1
D+27
Bobby Rush
Democratic
1992
Incumbent re-elected.
▌Y Bobby Rush (Democratic) 73.5% ▌Jimmy Tillman (Republican) 19.8%
Illinois 2
D+29
Robin Kelly
Democratic
2013 (special)
Incumbent re-elected.
▌Y Robin Kelly (Democratic) 81.1% ▌David Merkle (Republican) 18.9%
Illinois 3
D+6
Dan Lipinski
Democratic
2004
Incumbent re-elected.
▌Y Dan Lipinski (Democratic) 73.8% ▌Arthur Jones (Republican) 26.2%
Illinois 4
D+33
Luis Gutiérrez
Democratic
1992
Incumbent retired.Democratic hold.
▌Y Chuy García (Democratic) 86.6% ▌Mark Lorch (Republican) 13.4%
Illinois 5
D+20
Mike Quigley
Democratic
2009 (special)
Incumbent re-elected.
▌Y Mike Quigley (Democratic) 76.7% ▌Tom Hanson (Republican) 23.3%
Illinois 6
R+2
Peter Roskam
Republican
2006
Incumbent lost re-election.Democratic gain.
▌Y Sean Casten (Democratic) 53.6% ▌Peter Roskam (Republican) 46.4%
Illinois 7
D+38
Danny Davis
Democratic
1996
Incumbent re-elected.
▌Y Danny Davis (Democratic) 87.6% ▌Craig Cameron (Republican) 12.4%
Illinois 8
D+8
Raja Krishnamoorthi
Democratic
2016
Incumbent re-elected.
▌Y Raja Krishnamoorthi (Democratic) 66.0% ▌J. D. Diganvker (Republican) 34.0%
Illinois 9
D+18
Jan Schakowsky
Democratic
1998
Incumbent re-elected.
▌Y Jan Schakowsky (Democratic) 73.5% ▌John Elleson (Republican) 26.5%
Illinois 10
D+10
Brad Schneider
Democratic
20122014 (defeated)2016
Incumbent re-elected.
▌Y Brad Schneider (Democratic) 65.6% ▌Douglas Bennett (Republican) 34.4%
Illinois 11
D+9
Bill Foster
Democratic
2008 (special)2010 (defeated)2012
Incumbent re-elected.
▌Y Bill Foster (Democratic) 63.8% ▌Nick Stella (Republican) 36.2%
Illinois 12
R+5
Mike Bost
Republican
2014
Incumbent re-elected.
▌Y Mike Bost (Republican) 51.6% ▌Brendan Kelly (Democratic) 45.4% ▌Randall Auxier (Green) 3.0%
Illinois 13
R+3
Rodney Davis
Republican
2012
Incumbent re-elected.
▌Y Rodney Davis (Republican) 50.4% ▌Betsy Dirksen Londrigan (Democratic) 49.6%
Illinois 14
R+5
Randy Hultgren
Republican
2010
Incumbent lost re-election.Democratic gain.
▌Y Lauren Underwood (Democratic) 52.5% ▌Randy Hultgren (Republican) 47.5%
Illinois 15
R+21
John Shimkus
Republican
1996
Incumbent re-elected.
▌Y John Shimkus (Republican) 70.9% ▌Kevin Gaither (Democratic) 29.1%
Illinois 16
R+8
Adam Kinzinger
Republican
2010
Incumbent re-elected.
▌Y Adam Kinzinger (Republican) 59.1% ▌Sara Dady (Democratic) 40.9%
Illinois 17
D+3
Cheri Bustos
Democratic
2012
Incumbent re-elected.
▌Y Cheri Bustos (Democratic) 62.1% ▌Bill Fawell (Republican) 37.9%
Illinois 18
R+15
Darin LaHood
Republican
2015 (special)
Incumbent re-elected.
▌Y Darin LaHood (Republican) 67.2% ▌Junius Rodriguez (Democratic) 32.8%
· Indiana
Location
Location
District
Location
District
2017PVI
Incumbent
Representative
Incumbent
Party
Incumbent
Firstelected
Indiana 1
Indiana 1
District
Indiana 1
District
D+8
Incumbent
Pete Visclosky
Incumbent
Democratic
Incumbent
1984
Results
Incumbent re-elected.
Candidates
▌Y Pete Visclosky (Democratic) 65.1% ▌Mark Leyva (Republican) 34.9%
Indiana 2
Indiana 2
District
Indiana 2
District
R+11
Incumbent
Jackie Walorski
Incumbent
Republican
Incumbent
2012
Results
Incumbent re-elected.
Candidates
▌Y Jackie Walorski (Republican) 54.8% ▌Mel Hall (Democratic) 45.2%
Indiana 3
Indiana 3
District
Indiana 3
District
R+18
Incumbent
Jim Banks
Incumbent
Republican
Incumbent
2016
Results
Incumbent re-elected.
Candidates
▌Y Jim Banks (Republican) 64.7% ▌Courtney Tritch (Democratic) 35.3%
Indiana 4
Indiana 4
District
Indiana 4
District
R+17
Incumbent
Todd Rokita
Incumbent
Republican
Incumbent
2010
Results
Incumbent retired to run for U.S. Senator.Republican hold.
Candidates
▌Y Jim Baird (Republican) 64.1% ▌Tobi Beck (Democratic) 35.9%
Indiana 5
Indiana 5
District
Indiana 5
District
R+9
Incumbent
Susan Brooks
Incumbent
Republican
Incumbent
2012
Results
Incumbent re-elected.
Candidates
▌Y Susan Brooks (Republican) 56.8% ▌Dee Thornton (Democratic) 43.2%
Indiana 6
Indiana 6
District
Indiana 6
District
R+18
Incumbent
Luke Messer
Incumbent
Republican
Incumbent
2012
Results
Incumbent retired to run for U.S. Senator.Republican hold.
Candidates
▌Y Greg Pence (Republican) 63.8% ▌Jeannine Lake (Democratic) 32.9%
Indiana 7
Indiana 7
District
Indiana 7
District
D+11
Incumbent
André Carson
Incumbent
Democratic
Incumbent
2008 (special)
Results
Incumbent re-elected.
Candidates
▌Y André Carson (Democratic) 64.9% ▌Wayne Harmon (Republican) 35.1%
Indiana 8
Indiana 8
District
Indiana 8
District
R+15
Incumbent
Larry Bucshon
Incumbent
Republican
Incumbent
2010
Results
Incumbent re-elected.
Candidates
▌Y Larry Bucshon (Republican) 64.4% ▌William Tanoos (Democratic) 35.6%
Indiana 9
Indiana 9
District
Indiana 9
District
R+13
Incumbent
Trey Hollingsworth
Incumbent
Republican
Incumbent
2016
Results
Incumbent re-elected.
Candidates
▌Y Trey Hollingsworth (Republican) 56.5% ▌Liz Watson (Democratic) 43.5%
District
Incumbent
Results
Candidates
Location
2017PVI
Representative
Party
Firstelected
Indiana 1
D+8
Pete Visclosky
Democratic
1984
Incumbent re-elected.
▌Y Pete Visclosky (Democratic) 65.1% ▌Mark Leyva (Republican) 34.9%
Indiana 2
R+11
Jackie Walorski
Republican
2012
Incumbent re-elected.
▌Y Jackie Walorski (Republican) 54.8% ▌Mel Hall (Democratic) 45.2%
Indiana 3
R+18
Jim Banks
Republican
2016
Incumbent re-elected.
▌Y Jim Banks (Republican) 64.7% ▌Courtney Tritch (Democratic) 35.3%
Indiana 4
R+17
Todd Rokita
Republican
2010
Incumbent retired to run for U.S. Senator.Republican hold.
▌Y Jim Baird (Republican) 64.1% ▌Tobi Beck (Democratic) 35.9%
Indiana 5
R+9
Susan Brooks
Republican
2012
Incumbent re-elected.
▌Y Susan Brooks (Republican) 56.8% ▌Dee Thornton (Democratic) 43.2%
Indiana 6
R+18
Luke Messer
Republican
2012
Incumbent retired to run for U.S. Senator.Republican hold.
▌Y Greg Pence (Republican) 63.8% ▌Jeannine Lake (Democratic) 32.9%
Indiana 7
D+11
André Carson
Democratic
2008 (special)
Incumbent re-elected.
▌Y André Carson (Democratic) 64.9% ▌Wayne Harmon (Republican) 35.1%
Indiana 8
R+15
Larry Bucshon
Republican
2010
Incumbent re-elected.
▌Y Larry Bucshon (Republican) 64.4% ▌William Tanoos (Democratic) 35.6%
Indiana 9
R+13
Trey Hollingsworth
Republican
2016
Incumbent re-elected.
▌Y Trey Hollingsworth (Republican) 56.5% ▌Liz Watson (Democratic) 43.5%
· Iowa
Location
Location
District
Location
District
2017PVI
Incumbent
Representative
Incumbent
Party
Incumbent
Firstelected
Iowa 1
Iowa 1
District
Iowa 1
District
D+1
Incumbent
Rod Blum
Incumbent
Republican
Incumbent
2014
Results
Incumbent lost re-election.Democratic gain.
Candidates
▌Y Abby Finkenauer (Democratic) 51.0% ▌Rod Blum (Republican) 45.9% ▌Troy Hageman (Libertarian) 3.1%
Iowa 2
Iowa 2
District
Iowa 2
District
D+1
Incumbent
Dave Loebsack
Incumbent
Democratic
Incumbent
2006
Results
Incumbent re-elected.
Candidates
▌Y Dave Loebsack (Democratic) 54.8% ▌Christopher Peters (Republican) 42.6% ▌Mike Strauss (Libertarian) 2.0% ▌Daniel Clark (Independent) 0.6%
Iowa 3
Iowa 3
District
Iowa 3
District
R+1
Incumbent
David Young
Incumbent
Republican
Incumbent
2014
Results
Incumbent lost re-election.Democratic gain.
Candidates
▌Y Cindy Axne (Democratic) 49.3% ▌David Young (Republican) 47.2% ▌Bryan Holder (Libertarian) 2.0% Others ▌Mark Elworth (Legal Marijuana Now) 0.5% ▌Paul Knupp (Green) 0.5% ▌Joe Grandanette (Independent) 0.4%
Iowa 4
Iowa 4
District
Iowa 4
District
R+11
Incumbent
Steve King
Incumbent
Republican
Incumbent
2002
Results
Incumbent re-elected.
Candidates
▌Y Steve King (Republican) 50.4% ▌J. D. Scholten (Democratic) 47.0% ▌Charles Aldrich (Libertarian) 2.0% ▌Edward Peterson (Independent) 0.6%
District
Incumbent
Results
Candidates
Location
2017PVI
Representative
Party
Firstelected
Iowa 1
D+1
Rod Blum
Republican
2014
Incumbent lost re-election.Democratic gain.
▌Y Abby Finkenauer (Democratic) 51.0% ▌Rod Blum (Republican) 45.9% ▌Troy Hageman (Libertarian) 3.1%
Iowa 2
D+1
Dave Loebsack
Democratic
2006
Incumbent re-elected.
▌Y Dave Loebsack (Democratic) 54.8% ▌Christopher Peters (Republican) 42.6% ▌Mike Strauss (Libertarian) 2.0% ▌Daniel Clark (Independent) 0.6%
Iowa 3
R+1
David Young
Republican
2014
Incumbent lost re-election.Democratic gain.
▌Y Cindy Axne (Democratic) 49.3% ▌David Young (Republican) 47.2% ▌Bryan Holder (Libertarian) 2.0% Others ▌Mark Elworth (Legal Marijuana Now) 0.5% ▌Paul Knupp (Green) 0.5% ▌Joe Grandanette (Independent) 0.4%
Iowa 4
R+11
Steve King
Republican
2002
Incumbent re-elected.
▌Y Steve King (Republican) 50.4% ▌J. D. Scholten (Democratic) 47.0% ▌Charles Aldrich (Libertarian) 2.0% ▌Edward Peterson (Independent) 0.6%
· Kansas
Location
Location
District
Location
District
2017PVI
Incumbent
Representative
Incumbent
Party
Incumbent
Firstelected
Kansas 1
Kansas 1
District
Kansas 1
District
R+24
Incumbent
Roger Marshall
Incumbent
Republican
Incumbent
2016
Results
Incumbent re-elected.
Candidates
▌Y Roger Marshall (Republican) 68.1% ▌Alan LaPolice (Democratic) 31.9%
Kansas 2
Kansas 2
District
Kansas 2
District
R+10
Incumbent
Lynn Jenkins
Incumbent
Republican
Incumbent
2008
Results
Incumbent retired.Republican hold.
Candidates
▌Y Steve Watkins (Republican) 47.6% ▌Paul Davis (Democratic) 46.8% ▌Kelly Standley (Libertarian) 5.6%
Kansas 3
Kansas 3
District
Kansas 3
District
R+4
Incumbent
Kevin Yoder
Incumbent
Republican
Incumbent
2010
Results
Incumbent lost re-election.Democratic gain.
Candidates
▌Y Sharice Davids (Democratic) 53.6% ▌Kevin Yoder (Republican) 43.9% ▌Chris Clemmons (Libertarian) 2.5%
Kansas 4
Kansas 4
District
Kansas 4
District
R+15
Incumbent
Ron Estes
Incumbent
Republican
Incumbent
2017 (special)
Results
Incumbent re-elected.
Candidates
▌Y Ron Estes (Republican) 59.4% ▌James Thompson (Democratic) 40.6%
District
Incumbent
Results
Candidates
Location
2017PVI
Representative
Party
Firstelected
Kansas 1
R+24
Roger Marshall
Republican
2016
Incumbent re-elected.
▌Y Roger Marshall (Republican) 68.1% ▌Alan LaPolice (Democratic) 31.9%
Kansas 2
R+10
Lynn Jenkins
Republican
2008
Incumbent retired.Republican hold.
▌Y Steve Watkins (Republican) 47.6% ▌Paul Davis (Democratic) 46.8% ▌Kelly Standley (Libertarian) 5.6%
Kansas 3
R+4
Kevin Yoder
Republican
2010
Incumbent lost re-election.Democratic gain.
▌Y Sharice Davids (Democratic) 53.6% ▌Kevin Yoder (Republican) 43.9% ▌Chris Clemmons (Libertarian) 2.5%
Kansas 4
R+15
Ron Estes
Republican
2017 (special)
Incumbent re-elected.
▌Y Ron Estes (Republican) 59.4% ▌James Thompson (Democratic) 40.6%
· Kentucky
Location
Location
District
Location
District
2017PVI
Incumbent
Representative
Incumbent
Party
Incumbent
Firstelected
Kentucky 1
Kentucky 1
District
Kentucky 1
District
R+23
Incumbent
James Comer
Incumbent
Republican
Incumbent
2016
Results
Incumbent re-elected.
Candidates
▌Y James Comer (Republican) 68.6% ▌Paul Walker (Democratic) 31.4%
Kentucky 2
Kentucky 2
District
Kentucky 2
District
R+19
Incumbent
Brett Guthrie
Incumbent
Republican
Incumbent
2008
Results
Incumbent re-elected.
Candidates
▌Y Brett Guthrie (Republican) 66.7% ▌Hank Linderman (Democratic) 31.1% ▌Thomas Loecken (Independent) 2.2%
Kentucky 3
Kentucky 3
District
Kentucky 3
District
D+6
Incumbent
John Yarmuth
Incumbent
Democratic
Incumbent
2006
Results
Incumbent re-elected.
Candidates
▌Y John Yarmuth (Democratic) 62.1% ▌Vickie Glisson (Republican) 36.6% ▌Gregory Boles (Libertarian) 1.4%
Kentucky 4
Kentucky 4
District
Kentucky 4
District
R+18
Incumbent
Thomas Massie
Incumbent
Republican
Incumbent
2012
Results
Incumbent re-elected.
Candidates
▌Y Thomas Massie (Republican) 62.2% ▌Seth Hall (Democratic) 34.6% ▌Mike Moffett (Independent) 3.2%
Kentucky 5
Kentucky 5
District
Kentucky 5
District
R+31
Incumbent
Hal Rogers
Incumbent
Republican
Incumbent
1980
Results
Incumbent re-elected.
Candidates
▌Y Hal Rogers (Republican) 78.9% ▌Kenneth Stepp (Democratic) 21.1%
Kentucky 6
Kentucky 6
District
Kentucky 6
District
R+9
Incumbent
Andy Barr
Incumbent
Republican
Incumbent
2012
Results
Incumbent re-elected.
Candidates
▌Y Andy Barr (Republican) 51.0% ▌Amy McGrath (Democratic) 47.8% Others ▌Frank Harris (Libertarian) 0.7% ▌Rikka Wallin (Independent) 0.3% ▌James Germalic (Independent) 0.2%
District
Incumbent
Results
Candidates
Location
2017PVI
Representative
Party
Firstelected
Kentucky 1
R+23
James Comer
Republican
2016
Incumbent re-elected.
▌Y James Comer (Republican) 68.6% ▌Paul Walker (Democratic) 31.4%
Kentucky 2
R+19
Brett Guthrie
Republican
2008
Incumbent re-elected.
▌Y Brett Guthrie (Republican) 66.7% ▌Hank Linderman (Democratic) 31.1% ▌Thomas Loecken (Independent) 2.2%
Kentucky 3
D+6
John Yarmuth
Democratic
2006
Incumbent re-elected.
▌Y John Yarmuth (Democratic) 62.1% ▌Vickie Glisson (Republican) 36.6% ▌Gregory Boles (Libertarian) 1.4%
Kentucky 4
R+18
Thomas Massie
Republican
2012
Incumbent re-elected.
▌Y Thomas Massie (Republican) 62.2% ▌Seth Hall (Democratic) 34.6% ▌Mike Moffett (Independent) 3.2%
Kentucky 5
R+31
Hal Rogers
Republican
1980
Incumbent re-elected.
▌Y Hal Rogers (Republican) 78.9% ▌Kenneth Stepp (Democratic) 21.1%
Kentucky 6
R+9
Andy Barr
Republican
2012
Incumbent re-elected.
▌Y Andy Barr (Republican) 51.0% ▌Amy McGrath (Democratic) 47.8% Others ▌Frank Harris (Libertarian) 0.7% ▌Rikka Wallin (Independent) 0.3% ▌James Germalic (Independent) 0.2%
· Louisiana
Location
Location
District
Location
District
2017PVI
Incumbent
Representative
Incumbent
Party
Incumbent
Firstelected
Louisiana 1
Louisiana 1
District
Louisiana 1
District
R+24
Incumbent
Steve Scalise
Incumbent
Republican
Incumbent
2008 (special)
Results
Incumbent re-elected.
Candidates
▌Y Steve Scalise (Republican) 71.5% ▌Tammy Savoie (Democratic) 16.4% ▌Lee Ann Dugas (Democratic) 6.9% ▌Jim Francis (Democratic) 3.2% ▌Howard Kearney (Libertarian) 1.0% ▌Ferd Jones (Independent) 0.9%
Louisiana 2
Louisiana 2
District
Louisiana 2
District
D+25
Incumbent
Cedric Richmond
Incumbent
Democratic
Incumbent
2010
Results
Incumbent re-elected.
Candidates
▌Y Cedric Richmond (Democratic) 80.6% ▌Jesse Schmidt (Independent) 8.7% ▌Belden Batiste (Independent) 7.3% ▌Shawndra Rodriguez (Independent) 3.4%
Louisiana 3
Louisiana 3
District
Louisiana 3
District
R+20
Incumbent
Clay Higgins
Incumbent
Republican
Incumbent
2016
Results
Incumbent re-elected.
Candidates
▌Y Clay Higgins (Republican) 55.7% ▌Mimi Methvin (Democratic) 17.8% ▌Josh Guillory (Republican) 12.8% ▌Rob Anderson (Democratic) 5.5% ▌Larry Rader (Democratic) 3.9% ▌Verone Thomas (Democratic) 3.2% ▌Aaron Andrus (Libertarian) 1.2%
Louisiana 4
Louisiana 4
District
Louisiana 4
District
R+13
Incumbent
Mike Johnson
Incumbent
Republican
Incumbent
2016
Results
Incumbent re-elected.
Candidates
▌Y Mike Johnson (Republican) 64.2% ▌Ryan Trundle (Democratic) 33.6% ▌Mark Halverson (Independent) 2.1%
Louisiana 5
Louisiana 5
District
Louisiana 5
District
R+15
Incumbent
Ralph Abraham
Incumbent
Republican
Incumbent
2014
Results
Incumbent re-elected.
Candidates
▌Y Ralph Abraham (Republican) 66.5% ▌Jessee Fleenor (Democratic) 30.0% ▌Billy Burkette (Independent) 2.0% ▌Kyle Randol (Libertarian) 1.3%
Louisiana 6
Louisiana 6
District
Louisiana 6
District
R+19
Incumbent
Garret Graves
Incumbent
Republican
Incumbent
2014
Results
Incumbent re-elected.
Candidates
▌Y Garret Graves (Republican) 69.5% ▌Justin DeWitt (Democratic) 20.5% ▌Andie Saizan (Democratic) 8.1% ▌Devin Graham (Independent) 2.0%
District
Incumbent
Results
Candidates
Location
2017PVI
Representative
Party
Firstelected
Louisiana 1
R+24
Steve Scalise
Republican
2008 (special)
Incumbent re-elected.
▌Y Steve Scalise (Republican) 71.5% ▌Tammy Savoie (Democratic) 16.4% ▌Lee Ann Dugas (Democratic) 6.9% ▌Jim Francis (Democratic) 3.2% ▌Howard Kearney (Libertarian) 1.0% ▌Ferd Jones (Independent) 0.9%
Louisiana 2
D+25
Cedric Richmond
Democratic
2010
Incumbent re-elected.
▌Y Cedric Richmond (Democratic) 80.6% ▌Jesse Schmidt (Independent) 8.7% ▌Belden Batiste (Independent) 7.3% ▌Shawndra Rodriguez (Independent) 3.4%
Louisiana 3
R+20
Clay Higgins
Republican
2016
Incumbent re-elected.
▌Y Clay Higgins (Republican) 55.7% ▌Mimi Methvin (Democratic) 17.8% ▌Josh Guillory (Republican) 12.8% ▌Rob Anderson (Democratic) 5.5% ▌Larry Rader (Democratic) 3.9% ▌Verone Thomas (Democratic) 3.2% ▌Aaron Andrus (Libertarian) 1.2%
Louisiana 4
R+13
Mike Johnson
Republican
2016
Incumbent re-elected.
▌Y Mike Johnson (Republican) 64.2% ▌Ryan Trundle (Democratic) 33.6% ▌Mark Halverson (Independent) 2.1%
Louisiana 5
R+15
Ralph Abraham
Republican
2014
Incumbent re-elected.
▌Y Ralph Abraham (Republican) 66.5% ▌Jessee Fleenor (Democratic) 30.0% ▌Billy Burkette (Independent) 2.0% ▌Kyle Randol (Libertarian) 1.3%
Louisiana 6
R+19
Garret Graves
Republican
2014
Incumbent re-elected.
▌Y Garret Graves (Republican) 69.5% ▌Justin DeWitt (Democratic) 20.5% ▌Andie Saizan (Democratic) 8.1% ▌Devin Graham (Independent) 2.0%
· Maine
Location
Location
District
Location
District
2017PVI
Incumbent
Representative
Incumbent
Party
Incumbent
Firstelected
Maine 1
Maine 1
District
Maine 1
District
D+8
Incumbent
Chellie Pingree
Incumbent
Democratic
Incumbent
2008
Results
Incumbent re-elected.
Candidates
▌Y Chellie Pingree (Democratic) 58.7% ▌Mark Holbrook (Republican) 32.4% ▌Martin Grohman (Independent) 8.9%
Maine 2
Maine 2
District
Maine 2
District
R+2
Incumbent
Bruce Poliquin
Incumbent
Republican
Incumbent
2014
Results
Incumbent lost re-election.Democratic gain.
Candidates
First round: ▌Y Bruce Poliquin (Republican) 46.3% ▌Y Jared Golden (Democratic) 45.6% ▌Tiffany Bond (Independent) 5.7% ▌Will Hoar (Independent) 2.4% Instant runoff: ▌Y Jared Golden (Democratic) 50.6% ▌Bruce Poliquin (Republican) 49.4%
District
Incumbent
Results
Candidates
Location
2017PVI
Representative
Party
Firstelected
Maine 1
D+8
Chellie Pingree
Democratic
2008
Incumbent re-elected.
▌Y Chellie Pingree (Democratic) 58.7% ▌Mark Holbrook (Republican) 32.4% ▌Martin Grohman (Independent) 8.9%
Maine 2
R+2
Bruce Poliquin
Republican
2014
Incumbent lost re-election.Democratic gain.
First round: ▌Y Bruce Poliquin (Republican) 46.3% ▌Y Jared Golden (Democratic) 45.6% ▌Tiffany Bond (Independent) 5.7% ▌Will Hoar (Independent) 2.4% Instant runoff: ▌Y Jared Golden (Democratic) 50.6% ▌Bruce Poliquin (Republican) 49.4%
· Maryland
Location
Location
District
Location
District
2017PVI
Incumbent
Representative
Incumbent
Party
Incumbent
Firstelected
Maryland 1
Maryland 1
District
Maryland 1
District
R+14
Incumbent
Andy Harris
Incumbent
Republican
Incumbent
2010
Results
Incumbent re-elected.
Candidates
▌Y Andy Harris (Republican) 60.0% ▌Jesse Colvin (Democratic) 38.1% ▌Jenica Martin (Libertarian) 1.9%
Maryland 2
Maryland 2
District
Maryland 2
District
D+11
Incumbent
Dutch Ruppersberger
Incumbent
Democratic
Incumbent
2002
Results
Incumbent re-elected.
Candidates
▌Y Dutch Ruppersberger (Democratic) 66.1% ▌Liz Matory (Republican) 30.7% ▌Guy Mimoun (Green) 3.2%
Maryland 3
Maryland 3
District
Maryland 3
District
D+13
Incumbent
John Sarbanes
Incumbent
Democratic
Incumbent
2006
Results
Incumbent re-elected.
Candidates
▌Y John Sarbanes (Democratic) 69.2% ▌Charles Anthony (Republican) 28.3% ▌David Lashar (Libertarian) 2.5%
Maryland 4
Maryland 4
District
Maryland 4
District
D+28
Incumbent
Anthony Brown
Incumbent
Democratic
Incumbent
2016
Results
Incumbent re-elected.
Candidates
▌Y Anthony Brown (Democratic) 78.1% ▌George McDermott (Republican) 19.9% ▌David Bishop (Libertarian) 2.0%
Maryland 5
Maryland 5
District
Maryland 5
District
D+16
Incumbent
Steny Hoyer
Incumbent
Democratic
Incumbent
1981 (special)
Results
Incumbent re-elected.
Candidates
▌Y Steny Hoyer (Democratic) 70.4% ▌William Devine III (Republican) 27.1% ▌Pat Elder (Green) 1.3% ▌Jacob Pulcher (Libertarian) 1.2%
Maryland 6
Maryland 6
District
Maryland 6
District
D+6
Incumbent
John Delaney
Incumbent
Democratic
Incumbent
2012
Results
Incumbent retired to run for U.S. President.Democratic hold.
Candidates
▌Y David Trone (Democratic) 59.0% ▌Amie Hoeber (Republican) 38.0% ▌Kevin Caldwell (Libertarian) 1.8% ▌George Gluck (Green) 1.2%
Maryland 7
Maryland 7
District
Maryland 7
District
D+26
Incumbent
Elijah Cummings
Incumbent
Democratic
Incumbent
1996
Results
Incumbent re-elected.
Candidates
▌Y Elijah Cummings (Democratic) 76.5% ▌Richmond Davis (Republican) 21.3% ▌Swami Swaminathan (Independent) 2.2%
Maryland 8
Maryland 8
District
Maryland 8
District
D+14
Incumbent
Jamie Raskin
Incumbent
Democratic
Incumbent
2016
Results
Incumbent re-elected.
Candidates
▌Y Jamie Raskin (Democratic) 68.2% ▌John Walsh (Republican) 30.3% ▌Jasen Wunder (Libertarian) 1.5%
District
Incumbent
Results
Candidates
Location
2017PVI
Representative
Party
Firstelected
Maryland 1
R+14
Andy Harris
Republican
2010
Incumbent re-elected.
▌Y Andy Harris (Republican) 60.0% ▌Jesse Colvin (Democratic) 38.1% ▌Jenica Martin (Libertarian) 1.9%
Maryland 2
D+11
Dutch Ruppersberger
Democratic
2002
Incumbent re-elected.
▌Y Dutch Ruppersberger (Democratic) 66.1% ▌Liz Matory (Republican) 30.7% ▌Guy Mimoun (Green) 3.2%
Maryland 3
D+13
John Sarbanes
Democratic
2006
Incumbent re-elected.
▌Y John Sarbanes (Democratic) 69.2% ▌Charles Anthony (Republican) 28.3% ▌David Lashar (Libertarian) 2.5%
Maryland 4
D+28
Anthony Brown
Democratic
2016
Incumbent re-elected.
▌Y Anthony Brown (Democratic) 78.1% ▌George McDermott (Republican) 19.9% ▌David Bishop (Libertarian) 2.0%
Maryland 5
D+16
Steny Hoyer
Democratic
1981 (special)
Incumbent re-elected.
▌Y Steny Hoyer (Democratic) 70.4% ▌William Devine III (Republican) 27.1% ▌Pat Elder (Green) 1.3% ▌Jacob Pulcher (Libertarian) 1.2%
Maryland 6
D+6
John Delaney
Democratic
2012
Incumbent retired to run for U.S. President.Democratic hold.
▌Y David Trone (Democratic) 59.0% ▌Amie Hoeber (Republican) 38.0% ▌Kevin Caldwell (Libertarian) 1.8% ▌George Gluck (Green) 1.2%
Maryland 7
D+26
Elijah Cummings
Democratic
1996
Incumbent re-elected.
▌Y Elijah Cummings (Democratic) 76.5% ▌Richmond Davis (Republican) 21.3% ▌Swami Swaminathan (Independent) 2.2%
Maryland 8
D+14
Jamie Raskin
Democratic
2016
Incumbent re-elected.
▌Y Jamie Raskin (Democratic) 68.2% ▌John Walsh (Republican) 30.3% ▌Jasen Wunder (Libertarian) 1.5%
· Massachusetts
Location
Location
District
Location
District
2017PVI
Incumbent
Representative
Incumbent
Party
Incumbent
Firstelected
Massachusetts 1
Massachusetts 1
District
Massachusetts 1
District
D+12
Incumbent
Richard Neal
Incumbent
Democratic
Incumbent
1988
Results
Incumbent re-elected.
Candidates
▌Y Richard Neal (Democratic) Uncontested
Massachusetts 2
Massachusetts 2
District
Massachusetts 2
District
D+9
Incumbent
Jim McGovern
Incumbent
Democratic
Incumbent
1996
Results
Incumbent re-elected.
Candidates
▌Y Jim McGovern (Democratic) 67.2% ▌Tracy Lovvorn (Republican) 32.8%
Massachusetts 3
Massachusetts 3
District
Massachusetts 3
District
D+9
Incumbent
Niki Tsongas
Incumbent
Democratic
Incumbent
2007 (special)
Results
Incumbent retired.Democratic hold.
Candidates
▌Y Lori Trahan (Democratic) 62.0% ▌Rick Green (Republican) 33.5% ▌Michael Mullen (Independent) 4.5%
Massachusetts 4
Massachusetts 4
District
Massachusetts 4
District
D+9
Incumbent
Joe Kennedy III
Incumbent
Democratic
Incumbent
2012
Results
Incumbent re-elected.
Candidates
▌Y Joe Kennedy III (Democratic) Uncontested
Massachusetts 5
Massachusetts 5
District
Massachusetts 5
District
D+18
Incumbent
Katherine Clark
Incumbent
Democratic
Incumbent
2013 (special)
Results
Incumbent re-elected.
Candidates
▌Y Katherine Clark (Democratic) 75.9% ▌John Hugo (Republican) 24.1%
Massachusetts 6
Massachusetts 6
District
Massachusetts 6
District
D+6
Incumbent
Seth Moulton
Incumbent
Democratic
Incumbent
2014
Results
Incumbent re-elected.
Candidates
▌Y Seth Moulton (Democratic) 65.2% ▌Joseph Schneider (Republican) 31.4% ▌Mary Jean Charbonneau (Independent) 3.4%
Massachusetts 7
Massachusetts 7
District
Massachusetts 7
District
D+34
Incumbent
Mike Capuano
Incumbent
Democratic
Incumbent
1998
Results
Incumbent lost renomination.Democratic hold.
Candidates
▌Y Ayanna Pressley (Democratic) Uncontested
Massachusetts 8
Massachusetts 8
District
Massachusetts 8
District
D+10
Incumbent
Stephen Lynch
Incumbent
Democratic
Incumbent
2001 (special)
Results
Incumbent re-elected.
Candidates
▌Y Stephen Lynch (Democratic) Uncontested
Massachusetts 9
Massachusetts 9
District
Massachusetts 9
District
D+4
Incumbent
Bill Keating
Incumbent
Democratic
Incumbent
2010
Results
Incumbent re-elected.
Candidates
▌Y Bill Keating (Democratic) 59.4% ▌Peter Tedeschi (Republican) 40.6%
District
Incumbent
Results
Candidates
Location
2017PVI
Representative
Party
Firstelected
Massachusetts 1
D+12
Richard Neal
Democratic
1988
Incumbent re-elected.
▌Y Richard Neal (Democratic) Uncontested
Massachusetts 2
D+9
Jim McGovern
Democratic
1996
Incumbent re-elected.
▌Y Jim McGovern (Democratic) 67.2% ▌Tracy Lovvorn (Republican) 32.8%
Massachusetts 3
D+9
Niki Tsongas
Democratic
2007 (special)
Incumbent retired.Democratic hold.
▌Y Lori Trahan (Democratic) 62.0% ▌Rick Green (Republican) 33.5% ▌Michael Mullen (Independent) 4.5%
Massachusetts 4
D+9
Joe Kennedy III
Democratic
2012
Incumbent re-elected.
▌Y Joe Kennedy III (Democratic) Uncontested
Massachusetts 5
D+18
Katherine Clark
Democratic
2013 (special)
Incumbent re-elected.
▌Y Katherine Clark (Democratic) 75.9% ▌John Hugo (Republican) 24.1%
Massachusetts 6
D+6
Seth Moulton
Democratic
2014
Incumbent re-elected.
▌Y Seth Moulton (Democratic) 65.2% ▌Joseph Schneider (Republican) 31.4% ▌Mary Jean Charbonneau (Independent) 3.4%
Massachusetts 7
D+34
Mike Capuano
Democratic
1998
Incumbent lost renomination.Democratic hold.
▌Y Ayanna Pressley (Democratic) Uncontested
Massachusetts 8
D+10
Stephen Lynch
Democratic
2001 (special)
Incumbent re-elected.
▌Y Stephen Lynch (Democratic) Uncontested
Massachusetts 9
D+4
Bill Keating
Democratic
2010
Incumbent re-elected.
▌Y Bill Keating (Democratic) 59.4% ▌Peter Tedeschi (Republican) 40.6%
· Michigan
Location
Location
District
Location
District
2017PVI
Incumbent
Representative
Incumbent
Party
Incumbent
Firstelected
Michigan 1
Michigan 1
District
Michigan 1
District
R+9
Incumbent
Jack Bergman
Incumbent
Republican
Incumbent
2016
Results
Incumbent re-elected.
Candidates
▌Y Jack Bergman (Republican) 56.3% ▌Matt Morgan (Democratic) 43.7%
Michigan 2
Michigan 2
District
Michigan 2
District
R+9
Incumbent
Bill Huizenga
Incumbent
Republican
Incumbent
2010
Results
Incumbent re-elected.
Candidates
▌Y Bill Huizenga (Republican) 55.3% ▌Rob Davidson (Democratic) 43.0% ▌Ronald Graeser (U.S. Taxpayers) 1.7%
Michigan 3
Michigan 3
District
Michigan 3
District
R+6
Incumbent
Justin Amash
Incumbent
Republican
Incumbent
2010
Results
Incumbent re-elected.
Candidates
▌Y Justin Amash (Republican) 54.4% ▌Cathy Albro (Democratic) 43.2% ▌Ted Gerrard (U.S. Taxpayers) 2.4%
Michigan 4
Michigan 4
District
Michigan 4
District
R+10
Incumbent
John Moolenaar
Incumbent
Republican
Incumbent
2014
Results
Incumbent re-elected.
Candidates
▌Y John Moolenaar (Republican) 62.6% ▌Jerry Hilliard (Democratic) 37.4%
Michigan 5
Michigan 5
District
Michigan 5
District
D+5
Incumbent
Dan Kildee
Incumbent
Democratic
Incumbent
2012
Results
Incumbent re-elected.
Candidates
▌Y Dan Kildee (Democratic) 59.5% ▌Travis Wines (Republican) 35.9% ▌Kathy Goodwin (Working Class) 4.6%
Michigan 6
Michigan 6
District
Michigan 6
District
R+4
Incumbent
Fred Upton
Incumbent
Republican
Incumbent
1986
Results
Incumbent re-elected.
Candidates
▌Y Fred Upton (Republican) 50.2% ▌Matt Longjohn (Democratic) 45.7% ▌Stephen Young (U.S. Taxpayers) 4.1%
Michigan 7
Michigan 7
District
Michigan 7
District
R+7
Incumbent
Tim Walberg
Incumbent
Republican
Incumbent
20062008 (defeated)2010
Results
Incumbent re-elected.
Candidates
▌Y Tim Walberg (Republican) 53.8% ▌Gretchen Driskell (Democratic) 46.2%
Michigan 8
Michigan 8
District
Michigan 8
District
R+4
Incumbent
Mike Bishop
Incumbent
Republican
Incumbent
2014
Results
Incumbent lost re-election.Democratic gain.
Candidates
▌Y Elissa Slotkin (Democratic) 50.6% ▌Mike Bishop (Republican) 46.8% ▌Brian Ellison (Libertarian) 1.8% ▌David Lillis (U.S. Taxpayers) 0.8%
Michigan 9
Michigan 9
District
Michigan 9
District
D+4
Incumbent
Sander Levin
Incumbent
Democratic
Incumbent
1982
Results
Incumbent retired.Democratic hold.
Candidates
▌Y Andy Levin (Democratic) 59.6% ▌Candius Stearns (Republican) 36.8% ▌Andrea Kirby (Working Class) 2.2% ▌John McDermott (Green) 1.3%
Michigan 10
Michigan 10
District
Michigan 10
District
R+13
Incumbent
Paul Mitchell
Incumbent
Republican
Incumbent
2016
Results
Incumbent re-elected.
Candidates
▌Y Paul Mitchell (Republican) 60.3% ▌Kimberly Bizon (Democratic) 35.0% ▌Jeremy Peruski (Independent) 3.8% ▌Harley Mikkelson (Green) 1.0%
Michigan 11
Michigan 11
District
Michigan 11
District
R+4
Incumbent
David Trott
Incumbent
Republican
Incumbent
2014
Results
Incumbent retired.Democratic gain.
Candidates
▌Y Haley Stevens (Democratic) 51.8% ▌Lena Epstein (Republican) 45.2% ▌Leonard Schwartz (Libertarian) 1.7% ▌Cooper Nye (Independent) 1.3%
Michigan 12
Michigan 12
District
Michigan 12
District
D+14
Incumbent
Debbie Dingell
Incumbent
Democratic
Incumbent
2014
Results
Incumbent re-elected.
Candidates
▌Y Debbie Dingell (Democratic) 68.1% ▌Jeff Jones (Republican) 28.9% ▌Gary Walkowicz (Working Class) 2.3% ▌Niles Niemuth (Independent) 0.8%
Michigan 13
Michigan 13
District
Michigan 13
District
D+32
Incumbent
Vacant
Incumbent
Rep. John Conyers Jr. (D) resigned December 5, 2017.Democratic hold.A different Democratic candidate was elected the same day to finish the current term.
Incumbent
▌Y Rashida Tlaib (Democratic) 84.6% ▌Sam Johnson (Working Class) 11.3% ▌Etta Wilcoxon (Green) 4.1%
Michigan 14
Michigan 14
District
Michigan 14
District
D+30
Incumbent
Brenda Lawrence
Incumbent
Democratic
Incumbent
2014
Results
Incumbent re-elected.
Candidates
▌Y Brenda Lawrence (Democratic) 80.9% ▌Marc Herschfus (Republican) 17.3% ▌Philip Kolody (Working Class) 1.4%
District
Incumbent
Results
Candidates
Location
2017PVI
Representative
Party
Firstelected
Michigan 1
R+9
Jack Bergman
Republican
2016
Incumbent re-elected.
▌Y Jack Bergman (Republican) 56.3% ▌Matt Morgan (Democratic) 43.7%
Michigan 2
R+9
Bill Huizenga
Republican
2010
Incumbent re-elected.
▌Y Bill Huizenga (Republican) 55.3% ▌Rob Davidson (Democratic) 43.0% ▌Ronald Graeser (U.S. Taxpayers) 1.7%
Michigan 3
R+6
Justin Amash
Republican
2010
Incumbent re-elected.
▌Y Justin Amash (Republican) 54.4% ▌Cathy Albro (Democratic) 43.2% ▌Ted Gerrard (U.S. Taxpayers) 2.4%
Michigan 4
R+10
John Moolenaar
Republican
2014
Incumbent re-elected.
▌Y John Moolenaar (Republican) 62.6% ▌Jerry Hilliard (Democratic) 37.4%
Michigan 5
D+5
Dan Kildee
Democratic
2012
Incumbent re-elected.
▌Y Dan Kildee (Democratic) 59.5% ▌Travis Wines (Republican) 35.9% ▌Kathy Goodwin (Working Class) 4.6%
Michigan 6
R+4
Fred Upton
Republican
1986
Incumbent re-elected.
▌Y Fred Upton (Republican) 50.2% ▌Matt Longjohn (Democratic) 45.7% ▌Stephen Young (U.S. Taxpayers) 4.1%
Michigan 7
R+7
Tim Walberg
Republican
20062008 (defeated)2010
Incumbent re-elected.
▌Y Tim Walberg (Republican) 53.8% ▌Gretchen Driskell (Democratic) 46.2%
Michigan 8
R+4
Mike Bishop
Republican
2014
Incumbent lost re-election.Democratic gain.
▌Y Elissa Slotkin (Democratic) 50.6% ▌Mike Bishop (Republican) 46.8% ▌Brian Ellison (Libertarian) 1.8% ▌David Lillis (U.S. Taxpayers) 0.8%
Michigan 9
D+4
Sander Levin
Democratic
1982
Incumbent retired.Democratic hold.
▌Y Andy Levin (Democratic) 59.6% ▌Candius Stearns (Republican) 36.8% ▌Andrea Kirby (Working Class) 2.2% ▌John McDermott (Green) 1.3%
Michigan 10
R+13
Paul Mitchell
Republican
2016
Incumbent re-elected.
▌Y Paul Mitchell (Republican) 60.3% ▌Kimberly Bizon (Democratic) 35.0% ▌Jeremy Peruski (Independent) 3.8% ▌Harley Mikkelson (Green) 1.0%
Michigan 11
R+4
David Trott
Republican
2014
Incumbent retired.Democratic gain.
▌Y Haley Stevens (Democratic) 51.8% ▌Lena Epstein (Republican) 45.2% ▌Leonard Schwartz (Libertarian) 1.7% ▌Cooper Nye (Independent) 1.3%
Michigan 12
D+14
Debbie Dingell
Democratic
2014
Incumbent re-elected.
▌Y Debbie Dingell (Democratic) 68.1% ▌Jeff Jones (Republican) 28.9% ▌Gary Walkowicz (Working Class) 2.3% ▌Niles Niemuth (Independent) 0.8%
Michigan 13
D+32
Vacant
Rep. John Conyers Jr. (D) resigned December 5, 2017.Democratic hold.A different Democratic candidate was elected the same day to finish the current term.
▌Y Rashida Tlaib (Democratic) 84.6% ▌Sam Johnson (Working Class) 11.3% ▌Etta Wilcoxon (Green) 4.1%
Michigan 14
D+30
Brenda Lawrence
Democratic
2014
Incumbent re-elected.
▌Y Brenda Lawrence (Democratic) 80.9% ▌Marc Herschfus (Republican) 17.3% ▌Philip Kolody (Working Class) 1.4%
· Minnesota
Location
Location
District
Location
District
2017PVI
Incumbent
Representative
Incumbent
Party
Incumbent
Firstelected
Minnesota 1
Minnesota 1
District
Minnesota 1
District
R+5
Incumbent
Tim Walz
Incumbent
DFL
Incumbent
2006
Results
Incumbent retired to run for Governor of Minnesota.Republican gain.
Candidates
▌Y Jim Hagedorn (Republican) 50.2% ▌Dan Feehan (DFL) 49.8%
Minnesota 2
Minnesota 2
District
Minnesota 2
District
R+2
Incumbent
Jason Lewis
Incumbent
Republican
Incumbent
2016
Results
Incumbent lost re-election.DFL gain.
Candidates
▌Y Angie Craig (DFL) 52.8% ▌Jason Lewis (Republican) 47.2%
Minnesota 3
Minnesota 3
District
Minnesota 3
District
D+1
Incumbent
Erik Paulsen
Incumbent
Republican
Incumbent
2008
Results
Incumbent lost re-election.DFL gain.
Candidates
▌Y Dean Phillips (DFL) 55.7% ▌Erik Paulsen (Republican) 44.3%
Minnesota 4
Minnesota 4
District
Minnesota 4
District
D+14
Incumbent
Betty McCollum
Incumbent
DFL
Incumbent
2000
Results
Incumbent re-elected.
Candidates
▌Y Betty McCollum (DFL) 66.0% ▌Greg Ryan (Republican) 29.8% ▌Susan Pendergast Sindt (Legal Marijuana Now) 4.2%
Minnesota 5
Minnesota 5
District
Minnesota 5
District
D+26
Incumbent
Keith Ellison
Incumbent
DFL
Incumbent
2006
Results
Incumbent retired to run for Minnesota Attorney General.DFL hold.
Candidates
▌Y Ilhan Omar (DFL) 78.2% ▌Jennifer Zielinski (Republican) 21.8%
Minnesota 6
Minnesota 6
District
Minnesota 6
District
R+12
Incumbent
Tom Emmer
Incumbent
Republican
Incumbent
2014
Results
Incumbent re-elected.
Candidates
▌Y Tom Emmer (Republican) 61.2% ▌Ian Todd (DFL) 38.8%
Minnesota 7
Minnesota 7
District
Minnesota 7
District
R+12
Incumbent
Collin Peterson
Incumbent
DFL
Incumbent
1990
Results
Incumbent re-elected.
Candidates
▌Y Collin Peterson (DFL) 52.1% ▌Dave Hughes (Republican) 47.9%
Minnesota 8
Minnesota 8
District
Minnesota 8
District
R+4
Incumbent
Rick Nolan
Incumbent
DFL
Incumbent
19741980 (retired)2012
Results
Incumbent retired.Republican gain.
Candidates
▌Y Pete Stauber (Republican) 50.7% ▌Joe Radinovich (DFL) 45.2% ▌Skip Sandman (Independence) 4.1%
District
Incumbent
Results
Candidates
Location
2017PVI
Representative
Party
Firstelected
Minnesota 1
R+5
Tim Walz
DFL
2006
Incumbent retired to run for Governor of Minnesota.Republican gain.
▌Y Jim Hagedorn (Republican) 50.2% ▌Dan Feehan (DFL) 49.8%
Minnesota 2
R+2
Jason Lewis
Republican
2016
Incumbent lost re-election.DFL gain.
▌Y Angie Craig (DFL) 52.8% ▌Jason Lewis (Republican) 47.2%
Minnesota 3
D+1
Erik Paulsen
Republican
2008
Incumbent lost re-election.DFL gain.
▌Y Dean Phillips (DFL) 55.7% ▌Erik Paulsen (Republican) 44.3%
Minnesota 4
D+14
Betty McCollum
DFL
2000
Incumbent re-elected.
▌Y Betty McCollum (DFL) 66.0% ▌Greg Ryan (Republican) 29.8% ▌Susan Pendergast Sindt (Legal Marijuana Now) 4.2%
Minnesota 5
D+26
Keith Ellison
DFL
2006
Incumbent retired to run for Minnesota Attorney General.DFL hold.
▌Y Ilhan Omar (DFL) 78.2% ▌Jennifer Zielinski (Republican) 21.8%
Minnesota 6
R+12
Tom Emmer
Republican
2014
Incumbent re-elected.
▌Y Tom Emmer (Republican) 61.2% ▌Ian Todd (DFL) 38.8%
Minnesota 7
R+12
Collin Peterson
DFL
1990
Incumbent re-elected.
▌Y Collin Peterson (DFL) 52.1% ▌Dave Hughes (Republican) 47.9%
Minnesota 8
R+4
Rick Nolan
DFL
19741980 (retired)2012
Incumbent retired.Republican gain.
▌Y Pete Stauber (Republican) 50.7% ▌Joe Radinovich (DFL) 45.2% ▌Skip Sandman (Independence) 4.1%
· Mississippi
Location
Location
District
Location
District
2017PVI
Incumbent
Representative
Incumbent
Party
Incumbent
Firstelected
Mississippi 1
Mississippi 1
District
Mississippi 1
District
R+16
Incumbent
Trent Kelly
Incumbent
Republican
Incumbent
2015 (special)
Results
Incumbent re-elected.
Candidates
▌Y Trent Kelly (Republican) 66.9% ▌Randy Wadkins (Democratic) 32.4% ▌Tracella O'Hara Hill (Reform) 0.7%
Mississippi 2
Mississippi 2
District
Mississippi 2
District
D+14
Incumbent
Bennie Thompson
Incumbent
Democratic
Incumbent
1992
Results
Incumbent re-elected.
Candidates
▌Y Bennie Thompson (Democratic) 71.8% ▌Troy Ray (Independent) 21.7% ▌Irving Harris (Reform) 6.5%
Mississippi 3
Mississippi 3
District
Mississippi 3
District
R+13
Incumbent
Gregg Harper
Incumbent
Republican
Incumbent
2008
Results
Incumbent retired.Republican hold.
Candidates
▌Y Michael Guest (Republican) 62.3% ▌Michael Evans (Democratic) 36.7% ▌Matthew Holland (Reform) 1.0%
Mississippi 4
Mississippi 4
District
Mississippi 4
District
R+21
Incumbent
Steven Palazzo
Incumbent
Republican
Incumbent
2010
Results
Incumbent re-elected.
Candidates
▌Y Steven Palazzo (Republican) 68.2% ▌Jeramey Anderson (Democratic) 30.7% ▌Lajena Sheets (Reform) 1.0%
District
Incumbent
Results
Candidates
Location
2017PVI
Representative
Party
Firstelected
Mississippi 1
R+16
Trent Kelly
Republican
2015 (special)
Incumbent re-elected.
▌Y Trent Kelly (Republican) 66.9% ▌Randy Wadkins (Democratic) 32.4% ▌Tracella O'Hara Hill (Reform) 0.7%
Mississippi 2
D+14
Bennie Thompson
Democratic
1992
Incumbent re-elected.
▌Y Bennie Thompson (Democratic) 71.8% ▌Troy Ray (Independent) 21.7% ▌Irving Harris (Reform) 6.5%
Mississippi 3
R+13
Gregg Harper
Republican
2008
Incumbent retired.Republican hold.
▌Y Michael Guest (Republican) 62.3% ▌Michael Evans (Democratic) 36.7% ▌Matthew Holland (Reform) 1.0%
Mississippi 4
R+21
Steven Palazzo
Republican
2010
Incumbent re-elected.
▌Y Steven Palazzo (Republican) 68.2% ▌Jeramey Anderson (Democratic) 30.7% ▌Lajena Sheets (Reform) 1.0%
· Missouri
Location
Location
District
Location
District
2017PVI
Incumbent
Representative
Incumbent
Party
Incumbent
Firstelected
Missouri 1
Missouri 1
District
Missouri 1
District
D+29
Incumbent
Lacy Clay
Incumbent
Democratic
Incumbent
2000
Results
Incumbent re-elected.
Candidates
▌Y Lacy Clay (Democratic) 80.1% ▌Robert Vroman (Republican) 16.7% ▌Robb Cunningham (Libertarian) 3.2%
Missouri 2
Missouri 2
District
Missouri 2
District
R+8
Incumbent
Ann Wagner
Incumbent
Republican
Incumbent
2012
Results
Incumbent re-elected.
Candidates
▌Y Ann Wagner (Republican) 51.2% ▌Cort VanOstran (Democratic) 47.2% ▌Larry Kirk (Libertarian) 1.1% ▌David Arnold (Green) 0.5%
Missouri 3
Missouri 3
District
Missouri 3
District
R+18
Incumbent
Blaine Luetkemeyer
Incumbent
Republican
Incumbent
2008
Results
Incumbent re-elected.
Candidates
▌Y Blaine Luetkemeyer (Republican) 65.1% ▌Katy Geppert (Democratic) 32.8% ▌Donald Stolle (Libertarian) 2.1%
Missouri 4
Missouri 4
District
Missouri 4
District
R+17
Incumbent
Vicky Hartzler
Incumbent
Republican
Incumbent
2010
Results
Incumbent re-elected.
Candidates
▌Y Vicky Hartzler (Republican) 64.8% ▌Renee Hoagenson (Democratic) 32.7% ▌Mark Bliss (Libertarian) 2.4%
Missouri 5
Missouri 5
District
Missouri 5
District
D+7
Incumbent
Emanuel Cleaver
Incumbent
Democratic
Incumbent
2004
Results
Incumbent re-elected.
Candidates
▌Y Emanuel Cleaver (Democratic) 61.7% ▌Jacob Turk (Republican) 35.5% ▌Alexander Howell (Libertarian) 1.7% ▌Maurice Copeland (Green) 0.7% ▌E. C. Fredland (Constitution) 0.3%
Missouri 6
Missouri 6
District
Missouri 6
District
R+16
Incumbent
Sam Graves
Incumbent
Republican
Incumbent
2000
Results
Incumbent re-elected.
Candidates
▌Y Sam Graves (Republican) 65.4% ▌Henry Martin (Democratic) 32.0% ▌Dan Hogan (Libertarian) 2.6%
Missouri 7
Missouri 7
District
Missouri 7
District
R+23
Incumbent
Billy Long
Incumbent
Republican
Incumbent
2010
Results
Incumbent re-elected.
Candidates
▌Y Billy Long (Republican) 66.2% ▌Jamie Schoolcraft (Democratic) 30.1% ▌Benjamin Brixey (Libertarian) 3.7%
Missouri 8
Missouri 8
District
Missouri 8
District
R+24
Incumbent
Jason Smith
Incumbent
Republican
Incumbent
2013 (special)
Results
Incumbent re-elected.
Candidates
▌Y Jason Smith (Republican) 73.4% ▌Kathy Ellis (Democratic) 25.0% ▌Jonathan Shell (Libertarian) 1.6%
District
Incumbent
Results
Candidates
Location
2017PVI
Representative
Party
Firstelected
Missouri 1
D+29
Lacy Clay
Democratic
2000
Incumbent re-elected.
▌Y Lacy Clay (Democratic) 80.1% ▌Robert Vroman (Republican) 16.7% ▌Robb Cunningham (Libertarian) 3.2%
Missouri 2
R+8
Ann Wagner
Republican
2012
Incumbent re-elected.
▌Y Ann Wagner (Republican) 51.2% ▌Cort VanOstran (Democratic) 47.2% ▌Larry Kirk (Libertarian) 1.1% ▌David Arnold (Green) 0.5%
Missouri 3
R+18
Blaine Luetkemeyer
Republican
2008
Incumbent re-elected.
▌Y Blaine Luetkemeyer (Republican) 65.1% ▌Katy Geppert (Democratic) 32.8% ▌Donald Stolle (Libertarian) 2.1%
Missouri 4
R+17
Vicky Hartzler
Republican
2010
Incumbent re-elected.
▌Y Vicky Hartzler (Republican) 64.8% ▌Renee Hoagenson (Democratic) 32.7% ▌Mark Bliss (Libertarian) 2.4%
Missouri 5
D+7
Emanuel Cleaver
Democratic
2004
Incumbent re-elected.
▌Y Emanuel Cleaver (Democratic) 61.7% ▌Jacob Turk (Republican) 35.5% ▌Alexander Howell (Libertarian) 1.7% ▌Maurice Copeland (Green) 0.7% ▌E. C. Fredland (Constitution) 0.3%
Missouri 6
R+16
Sam Graves
Republican
2000
Incumbent re-elected.
▌Y Sam Graves (Republican) 65.4% ▌Henry Martin (Democratic) 32.0% ▌Dan Hogan (Libertarian) 2.6%
Missouri 7
R+23
Billy Long
Republican
2010
Incumbent re-elected.
▌Y Billy Long (Republican) 66.2% ▌Jamie Schoolcraft (Democratic) 30.1% ▌Benjamin Brixey (Libertarian) 3.7%
Missouri 8
R+24
Jason Smith
Republican
2013 (special)
Incumbent re-elected.
▌Y Jason Smith (Republican) 73.4% ▌Kathy Ellis (Democratic) 25.0% ▌Jonathan Shell (Libertarian) 1.6%
· Montana
Location
Location
District
Location
District
2017PVI
Incumbent
Representative
Incumbent
Party
Incumbent
Firstelected
Montana at-large
Montana at-large
District
Montana at-large
District
R+11
Incumbent
Greg Gianforte
Incumbent
Republican
Incumbent
2017 (special)
Results
Incumbent re-elected.
Candidates
▌Y Greg Gianforte (Republican) 50.9% ▌Kathleen Williams (Democratic) 46.2% ▌Elinor Swanson (Libertarian) 2.9%
District
Incumbent
Results
Candidates
Location
2017PVI
Representative
Party
Firstelected
Montana at-large
R+11
Greg Gianforte
Republican
2017 (special)
Incumbent re-elected.
▌Y Greg Gianforte (Republican) 50.9% ▌Kathleen Williams (Democratic) 46.2% ▌Elinor Swanson (Libertarian) 2.9%
· Nebraska
Location
Location
District
Location
District
2017PVI
Incumbent
Representative
Incumbent
Party
Incumbent
Firstelected
Nebraska 1
Nebraska 1
District
Nebraska 1
District
R+11
Incumbent
Jeff Fortenberry
Incumbent
Republican
Incumbent
2004
Results
Incumbent re-elected.
Candidates
▌Y Jeff Fortenberry (Republican) 60.4% ▌Jessica McClure (Democratic) 39.6%
Nebraska 2
Nebraska 2
District
Nebraska 2
District
R+4
Incumbent
Don Bacon
Incumbent
Republican
Incumbent
2016
Results
Incumbent re-elected.
Candidates
▌Y Don Bacon (Republican) 51.0% ▌Kara Eastman (Democratic) 49.0%
Nebraska 3
Nebraska 3
District
Nebraska 3
District
R+27
Incumbent
Adrian Smith
Incumbent
Republican
Incumbent
2006
Results
Incumbent re-elected.
Candidates
▌Y Adrian Smith (Republican) 76.7% ▌Paul Theobald (Democratic) 23.3%
District
Incumbent
Results
Candidates
Location
2017PVI
Representative
Party
Firstelected
Nebraska 1
R+11
Jeff Fortenberry
Republican
2004
Incumbent re-elected.
▌Y Jeff Fortenberry (Republican) 60.4% ▌Jessica McClure (Democratic) 39.6%
Nebraska 2
R+4
Don Bacon
Republican
2016
Incumbent re-elected.
▌Y Don Bacon (Republican) 51.0% ▌Kara Eastman (Democratic) 49.0%
Nebraska 3
R+27
Adrian Smith
Republican
2006
Incumbent re-elected.
▌Y Adrian Smith (Republican) 76.7% ▌Paul Theobald (Democratic) 23.3%
· Nevada
Location
Location
District
Location
District
2017PVI
Incumbent
Representative
Incumbent
Party
Incumbent
Firstelected
Nevada 1
Nevada 1
District
Nevada 1
District
D+15
Incumbent
Dina Titus
Incumbent
Democratic
Incumbent
20082010 (defeated)2012
Results
Incumbent re-elected.
Candidates
▌Y Dina Titus (Democratic) 66.2% ▌Joyce Bentley (Republican) 30.9% ▌Dan Garfield (Independent American) 1.6% ▌Robert Strawder (Libertarian) 1.4%
Nevada 2
Nevada 2
District
Nevada 2
District
R+7
Incumbent
Mark Amodei
Incumbent
Republican
Incumbent
2011 (special)
Results
Incumbent re-elected.
Candidates
▌Y Mark Amodei (Republican) 58.2% ▌Clint Koble (Democratic) 41.8%
Nevada 3
Nevada 3
District
Nevada 3
District
R+2
Incumbent
Jacky Rosen
Incumbent
Democratic
Incumbent
2016
Results
Incumbent retired to run for U.S. Senator.Democratic hold.
Candidates
▌Y Susie Lee (Democratic) 51.9% ▌Danny Tarkanian (Republican) 42.8% ▌Steve Brown (Libertarian) 1.6% ▌David Goossen (Independent) 1.3% ▌Harry Vickers (Independent American) 1.2% Others ▌Gil Eisner (Independent) 0.7% ▌Tony Gumina (Independent) 0.5%
Nevada 4
Nevada 4
District
Nevada 4
District
D+3
Incumbent
Ruben Kihuen
Incumbent
Democratic
Incumbent
2016
Results
Incumbent retired.Democratic hold.
Candidates
▌Y Steven Horsford (Democratic) 51.9% ▌Cresent Hardy (Republican) 43.7% ▌Warren Markowitz (Independent American) 1.4% ▌Rodney Smith (Independent) 1.2% Others ▌Gregg Luckner (Libertarian) 0.9% ▌Dean McGonigle (Independent) 0.9%
District
Incumbent
Results
Candidates
Location
2017PVI
Representative
Party
Firstelected
Nevada 1
D+15
Dina Titus
Democratic
20082010 (defeated)2012
Incumbent re-elected.
▌Y Dina Titus (Democratic) 66.2% ▌Joyce Bentley (Republican) 30.9% ▌Dan Garfield (Independent American) 1.6% ▌Robert Strawder (Libertarian) 1.4%
Nevada 2
R+7
Mark Amodei
Republican
2011 (special)
Incumbent re-elected.
▌Y Mark Amodei (Republican) 58.2% ▌Clint Koble (Democratic) 41.8%
Nevada 3
R+2
Jacky Rosen
Democratic
2016
Incumbent retired to run for U.S. Senator.Democratic hold.
▌Y Susie Lee (Democratic) 51.9% ▌Danny Tarkanian (Republican) 42.8% ▌Steve Brown (Libertarian) 1.6% ▌David Goossen (Independent) 1.3% ▌Harry Vickers (Independent American) 1.2% Others ▌Gil Eisner (Independent) 0.7% ▌Tony Gumina (Independent) 0.5%
Nevada 4
D+3
Ruben Kihuen
Democratic
2016
Incumbent retired.Democratic hold.
▌Y Steven Horsford (Democratic) 51.9% ▌Cresent Hardy (Republican) 43.7% ▌Warren Markowitz (Independent American) 1.4% ▌Rodney Smith (Independent) 1.2% Others ▌Gregg Luckner (Libertarian) 0.9% ▌Dean McGonigle (Independent) 0.9%
· New Hampshire
Location
Location
District
Location
District
2017PVI
Incumbent
Representative
Incumbent
Party
Incumbent
Firstelected
New Hampshire 1
New Hampshire 1
District
New Hampshire 1
District
R+2
Incumbent
Carol Shea-Porter
Incumbent
Democratic
Incumbent
20062010 (defeated)20122014 (defeated)2016
Results
Incumbent retired.Democratic hold.
Candidates
▌Y Chris Pappas (Democratic) 53.6% ▌Eddie Edwards (Republican) 45.0% ▌Dan Belforti (Libertarian) 1.4%
New Hampshire 2
New Hampshire 2
District
New Hampshire 2
District
D+2
Incumbent
Annie Kuster
Incumbent
Democratic
Incumbent
2012
Results
Incumbent re-elected.
Candidates
▌Y Annie Kuster (Democratic) 55.6% ▌Steve Negron (Republican) 42.2% ▌Justin O'Donnell (Libertarian) 2.2%
District
Incumbent
Results
Candidates
Location
2017PVI
Representative
Party
Firstelected
New Hampshire 1
R+2
Carol Shea-Porter
Democratic
20062010 (defeated)20122014 (defeated)2016
Incumbent retired.Democratic hold.
▌Y Chris Pappas (Democratic) 53.6% ▌Eddie Edwards (Republican) 45.0% ▌Dan Belforti (Libertarian) 1.4%
New Hampshire 2
D+2
Annie Kuster
Democratic
2012
Incumbent re-elected.
▌Y Annie Kuster (Democratic) 55.6% ▌Steve Negron (Republican) 42.2% ▌Justin O'Donnell (Libertarian) 2.2%
· New Jersey
Location
Location
District
Location
District
2017PVI
Incumbent
Representative
Incumbent
Party
Incumbent
Firstelected
New Jersey 1
New Jersey 1
District
New Jersey 1
District
D+13
Incumbent
Donald Norcross
Incumbent
Democratic
Incumbent
2014
Results
Incumbent re-elected.
Candidates
▌Y Donald Norcross (Democratic) 64.4% ▌Paul Dilks (Republican) 33.3% ▌Robert Shapiro (Independent) 1.1% Others ▌Paul Hamlin (Independent) 0.9% ▌Mohammad Kabir (Independent) 0.4%
New Jersey 2
New Jersey 2
District
New Jersey 2
District
R+1
Incumbent
Frank LoBiondo
Incumbent
Republican
Incumbent
1994
Results
Incumbent retired.Democratic gain.
Candidates
▌Y Jeff Van Drew (Democratic) 52.9% ▌Seth Grossman (Republican) 45.2% Others ▌John Ordille (Independent) 0.7% ▌Steven Fenichel (Independent) 0.4% ▌Anthony Sanchez (Independent) 0.4% ▌William Benfer (Independent) 0.3%
New Jersey 3
New Jersey 3
District
New Jersey 3
District
R+2
Incumbent
Tom MacArthur
Incumbent
Republican
Incumbent
2014
Results
Incumbent lost re-election.Democratic gain.
Candidates
▌Y Andy Kim (Democratic) 50.0% ▌Tom MacArthur (Republican) 48.7% ▌Lawrence Berlinski (Independent) 1.3%
New Jersey 4
New Jersey 4
District
New Jersey 4
District
R+8
Incumbent
Chris Smith
Incumbent
Republican
Incumbent
1980
Results
Incumbent re-elected.
Candidates
▌Y Chris Smith (Republican) 55.4% ▌Josh Welle (Democratic) 43.1% Others ▌Michael Rufo (Independent) 0.5% ▌Edward Stackhouse (Independent) 0.4% ▌Brian Reynolds (Independent) 0.3% ▌Felicia Stoler (Independent) 0.3% ▌Allen Yusufov (Independent) 0.1%
New Jersey 5
New Jersey 5
District
New Jersey 5
District
R+3
Incumbent
Josh Gottheimer
Incumbent
Democratic
Incumbent
2016
Results
Incumbent re-elected.
Candidates
▌Y Josh Gottheimer (Democratic) 56.2% ▌John McCann (Republican) 42.5% Others ▌James Tosone (Independent) 0.7% ▌Wendy Goetz (Independent) 0.6%
New Jersey 6
New Jersey 6
District
New Jersey 6
District
D+9
Incumbent
Frank Pallone
Incumbent
Democratic
Incumbent
1988
Results
Incumbent re-elected.
Candidates
▌Y Frank Pallone (Democratic) 63.6% ▌Rich Pezzullo (Republican) 36.4%
New Jersey 7
New Jersey 7
District
New Jersey 7
District
R+3
Incumbent
Leonard Lance
Incumbent
Republican
Incumbent
2008
Results
Incumbent lost re-election.Democratic gain.
Candidates
▌Y Tom Malinowski (Democratic) 51.7% ▌Leonard Lance (Republican) 46.7% ▌Diane Moxley (Green) 0.8% ▌Gregg Mele (Independent) 0.7%
New Jersey 8
New Jersey 8
District
New Jersey 8
District
D+27
Incumbent
Albio Sires
Incumbent
Democratic
Incumbent
2006
Results
Incumbent re-elected.
Candidates
▌Y Albio Sires (Democratic) 78.1% ▌John Muniz (Republican) 18.7%
New Jersey 9
New Jersey 9
District
New Jersey 9
District
D+16
Incumbent
Bill Pascrell
Incumbent
Democratic
Incumbent
1996
Results
Incumbent re-elected.
Candidates
▌Y Bill Pascrell (Democratic) 70.3% ▌Eric Fisher (Republican) 28.9% ▌Claudio Belusic (Independent) 0.8%
New Jersey 10
New Jersey 10
District
New Jersey 10
District
D+36
Incumbent
Donald Payne Jr.
Incumbent
Democratic
Incumbent
2012 (Special)
Results
Incumbent re-elected.
Candidates
▌Y Donald Payne Jr. (Democratic) 87.6% ▌Agha Khan (Republican) 10.1% ▌Cynthia Johnson (Independent) 1.0% ▌Joanne Miller (Independent) 1.0% ▌Scott Dirona (Independent) 0.3%
New Jersey 11
New Jersey 11
District
New Jersey 11
District
R+3
Incumbent
Rodney Frelinghuysen
Incumbent
Republican
Incumbent
1994
Results
Incumbent retired.Democratic gain.
Candidates
▌Y Mikie Sherrill (Democratic) 56.8% ▌Jay Webber (Republican) 42.1% ▌Robert Crook (Independent) 0.7% ▌Ryan Martinez (Independent) 0.4%
New Jersey 12
New Jersey 12
District
New Jersey 12
District
D+16
Incumbent
Bonnie Watson Coleman
Incumbent
Democratic
Incumbent
2014
Results
Incumbent re-elected.
Candidates
▌Y Bonnie Watson Coleman (Democratic) 68.7% ▌Daryl Kipnis (Republican) 31.3%
District
Incumbent
Results
Candidates
Location
2017PVI
Representative
Party
Firstelected
New Jersey 1
D+13
Donald Norcross
Democratic
2014
Incumbent re-elected.
▌Y Donald Norcross (Democratic) 64.4% ▌Paul Dilks (Republican) 33.3% ▌Robert Shapiro (Independent) 1.1% Others ▌Paul Hamlin (Independent) 0.9% ▌Mohammad Kabir (Independent) 0.4%
New Jersey 2
R+1
Frank LoBiondo
Republican
1994
Incumbent retired.Democratic gain.
▌Y Jeff Van Drew (Democratic) 52.9% ▌Seth Grossman (Republican) 45.2% Others ▌John Ordille (Independent) 0.7% ▌Steven Fenichel (Independent) 0.4% ▌Anthony Sanchez (Independent) 0.4% ▌William Benfer (Independent) 0.3%
New Jersey 3
R+2
Tom MacArthur
Republican
2014
Incumbent lost re-election.Democratic gain.
▌Y Andy Kim (Democratic) 50.0% ▌Tom MacArthur (Republican) 48.7% ▌Lawrence Berlinski (Independent) 1.3%
New Jersey 4
R+8
Chris Smith
Republican
1980
Incumbent re-elected.
▌Y Chris Smith (Republican) 55.4% ▌Josh Welle (Democratic) 43.1% Others ▌Michael Rufo (Independent) 0.5% ▌Edward Stackhouse (Independent) 0.4% ▌Brian Reynolds (Independent) 0.3% ▌Felicia Stoler (Independent) 0.3% ▌Allen Yusufov (Independent) 0.1%
New Jersey 5
R+3
Josh Gottheimer
Democratic
2016
Incumbent re-elected.
▌Y Josh Gottheimer (Democratic) 56.2% ▌John McCann (Republican) 42.5% Others ▌James Tosone (Independent) 0.7% ▌Wendy Goetz (Independent) 0.6%
New Jersey 6
D+9
Frank Pallone
Democratic
1988
Incumbent re-elected.
▌Y Frank Pallone (Democratic) 63.6% ▌Rich Pezzullo (Republican) 36.4%
New Jersey 7
R+3
Leonard Lance
Republican
2008
Incumbent lost re-election.Democratic gain.
▌Y Tom Malinowski (Democratic) 51.7% ▌Leonard Lance (Republican) 46.7% ▌Diane Moxley (Green) 0.8% ▌Gregg Mele (Independent) 0.7%
New Jersey 8
D+27
Albio Sires
Democratic
2006
Incumbent re-elected.
▌Y Albio Sires (Democratic) 78.1% ▌John Muniz (Republican) 18.7%
New Jersey 9
D+16
Bill Pascrell
Democratic
1996
Incumbent re-elected.
▌Y Bill Pascrell (Democratic) 70.3% ▌Eric Fisher (Republican) 28.9% ▌Claudio Belusic (Independent) 0.8%
New Jersey 10
D+36
Donald Payne Jr.
Democratic
2012 (Special)
Incumbent re-elected.
▌Y Donald Payne Jr. (Democratic) 87.6% ▌Agha Khan (Republican) 10.1% ▌Cynthia Johnson (Independent) 1.0% ▌Joanne Miller (Independent) 1.0% ▌Scott Dirona (Independent) 0.3%
New Jersey 11
R+3
Rodney Frelinghuysen
Republican
1994
Incumbent retired.Democratic gain.
▌Y Mikie Sherrill (Democratic) 56.8% ▌Jay Webber (Republican) 42.1% ▌Robert Crook (Independent) 0.7% ▌Ryan Martinez (Independent) 0.4%
New Jersey 12
D+16
Bonnie Watson Coleman
Democratic
2014
Incumbent re-elected.
▌Y Bonnie Watson Coleman (Democratic) 68.7% ▌Daryl Kipnis (Republican) 31.3%
· New Mexico
Location
Location
District
Location
District
2017PVI
Incumbent
Representative
Incumbent
Party
Incumbent
Firstelected
New Mexico 1
New Mexico 1
District
New Mexico 1
District
D+7
Incumbent
Michelle Luján Grisham
Incumbent
Democratic
Incumbent
2012
Results
Incumbent retired to run for Governor of New Mexico.Democratic hold.
Candidates
▌Y Deb Haaland (Democratic) 59.1% ▌Janice Arnold-Jones (Republican) 36.3% ▌Lloyd Princeton (Libertarian) 4.6%
New Mexico 2
New Mexico 2
District
New Mexico 2
District
R+6
Incumbent
Steve Pearce
Incumbent
Republican
Incumbent
20022008 (retired)2010
Results
Incumbent retired to run for Governor of New Mexico.Democratic gain.
Candidates
▌Y Xochitl Torres Small (Democratic) 50.9% ▌Yvette Herrell (Republican) 49.1%
New Mexico 3
New Mexico 3
District
New Mexico 3
District
D+8
Incumbent
Ben Ray Luján
Incumbent
Democratic
Incumbent
2008
Results
Incumbent re-elected.
Candidates
▌Y Ben Ray Luján (Democratic) 63.4% ▌Jerald Steve McFall (Republican) 31.2% ▌Christopher Manning (Libertarian) 5.4%
District
Incumbent
Results
Candidates
Location
2017PVI
Representative
Party
Firstelected
New Mexico 1
D+7
Michelle Luján Grisham
Democratic
2012
Incumbent retired to run for Governor of New Mexico.Democratic hold.
▌Y Deb Haaland (Democratic) 59.1% ▌Janice Arnold-Jones (Republican) 36.3% ▌Lloyd Princeton (Libertarian) 4.6%
New Mexico 2
R+6
Steve Pearce
Republican
20022008 (retired)2010
Incumbent retired to run for Governor of New Mexico.Democratic gain.
▌Y Xochitl Torres Small (Democratic) 50.9% ▌Yvette Herrell (Republican) 49.1%
New Mexico 3
D+8
Ben Ray Luján
Democratic
2008
Incumbent re-elected.
▌Y Ben Ray Luján (Democratic) 63.4% ▌Jerald Steve McFall (Republican) 31.2% ▌Christopher Manning (Libertarian) 5.4%
· New York
Location
Location
District
Location
District
2017PVI
Incumbent
Representative
Incumbent
Party
Incumbent
Firstelected
New York 1
New York 1
District
New York 1
District
R+5
Incumbent
Lee Zeldin
Incumbent
Republican
Incumbent
2014
Results
Incumbent re-elected.
Candidates
▌Y Lee Zeldin (Republican) 51.5% ▌Perry Gershon (Democratic) 47.4% ▌Kate Browning (Women's Equality) 1.1%
New York 2
New York 2
District
New York 2
District
R+3
Incumbent
Peter King
Incumbent
Republican
Incumbent
1992
Results
Incumbent re-elected.
Candidates
▌Y Peter King (Republican) 53.1% ▌Liuba Grechen Shirley (Democratic) 46.9%
New York 3
New York 3
District
New York 3
District
D+1
Incumbent
Thomas Suozzi
Incumbent
Democratic
Incumbent
2016
Results
Incumbent re-elected.
Candidates
▌Y Thomas Suozzi (Democratic) 59.0% ▌Dan DeBono (Republican) 41.0%
New York 4
New York 4
District
New York 4
District
D+4
Incumbent
Kathleen Rice
Incumbent
Democratic
Incumbent
2014
Results
Incumbent re-elected.
Candidates
▌Y Kathleen Rice (Democratic) 61.3% ▌Ameer Benno (Republican) 38.7%
New York 5
New York 5
District
New York 5
District
D+37
Incumbent
Gregory Meeks
Incumbent
Democratic
Incumbent
1998
Results
Incumbent re-elected.
Candidates
▌Y Gregory Meeks (Democratic) Uncontested
New York 6
New York 6
District
New York 6
District
D+16
Incumbent
Grace Meng
Incumbent
Democratic
Incumbent
2012
Results
Incumbent re-elected.
Candidates
▌Y Grace Meng (Democratic) 90.9% ▌Tom Hillgardner (Green) 9.1%
New York 7
New York 7
District
New York 7
District
D+38
Incumbent
Nydia Velázquez
Incumbent
Democratic
Incumbent
1992
Results
Incumbent re-elected.
Candidates
▌Y Nydia Velázquez (Democratic) 93.4% ▌Joseph Lieberman (Conservative) 5.5% ▌Jeff Kurzon (Reform) 1.1%
New York 8
New York 8
District
New York 8
District
D+36
Incumbent
Hakeem Jeffries
Incumbent
Democratic
Incumbent
2012
Results
Incumbent re-elected.
Candidates
▌Y Hakeem Jeffries (Democratic) 94.2% ▌Ernest Johnson (Conservative) 5.2% ▌Jessica White (Reform) 0.5%
New York 9
New York 9
District
New York 9
District
D+34
Incumbent
Yvette Clarke
Incumbent
Democratic
Incumbent
2006
Results
Incumbent re-elected.
Candidates
▌Y Yvette Clarke (Democratic) 89.3% ▌Lutchi Gayot (Republican) 10.3% ▌Joel Anabilah-Azumah (Reform) 0.4%
New York 10
New York 10
District
New York 10
District
D+26
Incumbent
Jerry Nadler
Incumbent
Democratic
Incumbent
1992
Results
Incumbent re-elected.
Candidates
▌Y Jerry Nadler (Democratic) 82.1% ▌Naomi Levin (Republican) 17.9%
New York 11
New York 11
District
New York 11
District
R+3
Incumbent
Dan Donovan
Incumbent
Republican
Incumbent
2015 (special)
Results
Incumbent lost re-election.Democratic gain.
Candidates
▌Y Max Rose (Democratic) 53.0% ▌Dan Donovan (Republican) 46.6% ▌Henry Bardel (Green) 0.4%
New York 12
New York 12
District
New York 12
District
D+31
Incumbent
Carolyn Maloney
Incumbent
Democratic
Incumbent
1992
Results
Incumbent re-elected.
Candidates
▌Y Carolyn Maloney (Democratic) 86.4% ▌Eliot Rabin (Republican) 12.1% ▌Scott Hutchins (Green) 1.5%
New York 13
New York 13
District
New York 13
District
D+43
Incumbent
Adriano Espaillat
Incumbent
Democratic
Incumbent
2016
Results
Incumbent re-elected.
Candidates
▌Y Adriano Espaillat (Democratic) 94.6% ▌Jineea Butler (Republican) 5.4%
New York 14
New York 14
District
New York 14
District
D+29
Incumbent
Joe Crowley
Incumbent
Democratic
Incumbent
1998
Results
Incumbent lost renomination, ran as Working Families nominee, and lost re-election.New member elected.Democratic hold.
Candidates
▌Y Alexandria Ocasio-Cortez (Democratic) 78.2% ▌Anthony Pappas (Republican) 13.6% ▌Joe Crowley (Working Families) 6.6% ▌Elizabeth Perri (Conservative) 1.6%
New York 15
New York 15
District
New York 15
District
D+44
Incumbent
José E. Serrano
Incumbent
Democratic
Incumbent
1990
Results
Incumbent re-elected.
Candidates
▌Y José E. Serrano (Democratic) 96.0% ▌Jason Gonzalez (Republican) 4.0%
New York 16
New York 16
District
New York 16
District
D+24
Incumbent
Eliot Engel
Incumbent
Democratic
Incumbent
1988
Results
Incumbent re-elected.
Candidates
▌Y Eliot Engel (Democratic) Uncontested
New York 17
New York 17
District
New York 17
District
D+7
Incumbent
Nita Lowey
Incumbent
Democratic
Incumbent
1988
Results
Incumbent re-elected.
Candidates
▌Y Nita Lowey (Democratic) 88.0% ▌Joe Ciardullo (Reform) 12.0%
New York 18
New York 18
District
New York 18
District
R+1
Incumbent
Sean Patrick Maloney
Incumbent
Democratic
Incumbent
2012
Results
Incumbent re-elected.
Candidates
▌Y Sean Patrick Maloney (Democratic) 55.5% ▌James O'Donnell (Republican) 44.5%
New York 19
New York 19
District
New York 19
District
R+2
Incumbent
John Faso
Incumbent
Republican
Incumbent
2016
Results
Incumbent lost re-election.Democratic gain.
Candidates
▌Y Antonio Delgado (Democratic) 51.4% ▌John Faso (Republican) 46.2% ▌Steven Greenfield (Green) 1.5% ▌Diane Neal (Independent) 1.0%
New York 20
New York 20
District
New York 20
District
D+7
Incumbent
Paul Tonko
Incumbent
Democratic
Incumbent
2008
Results
Incumbent re-elected.
Candidates
▌Y Paul Tonko (Democratic) 66.5% ▌Joe Vitollo (Republican) 33.5%
New York 21
New York 21
District
New York 21
District
R+4
Incumbent
Elise Stefanik
Incumbent
Republican
Incumbent
2014
Results
Incumbent re-elected.
Candidates
▌Y Elise Stefanik (Republican) 56.1% ▌Tedra Cobb (Democratic) 42.4% ▌Lynn Kahn (Green) 1.5%
New York 22
New York 22
District
New York 22
District
R+6
Incumbent
Claudia Tenney
Incumbent
Republican
Incumbent
2016
Results
Incumbent lost re-election.Democratic gain.
Candidates
▌Y Anthony Brindisi (Democratic) 50.9% ▌Claudia Tenney (Republican) 49.1%
New York 23
New York 23
District
New York 23
District
R+6
Incumbent
Tom Reed
Incumbent
Republican
Incumbent
2010 (special)
Results
Incumbent re-elected.
Candidates
▌Y Tom Reed (Republican) 54.2% ▌Tracy Mitrano (Democratic) 45.8%
New York 24
New York 24
District
New York 24
District
D+3
Incumbent
John Katko
Incumbent
Republican
Incumbent
2014
Results
Incumbent re-elected.
Candidates
▌Y John Katko (Republican) 52.6% ▌Dana Balter (Democratic) 47.4%
New York 25
New York 25
District
New York 25
District
D+8
Incumbent
Vacant
Incumbent
Incumbent Louise Slaughter died March 16, 2018.Democratic hold.Winner was also elected to fill unexpired term, see above.
Incumbent
▌Y Joseph Morelle (Democratic) 59.0% ▌Jim Maxwell (Republican) 41.0%
New York 26
New York 26
District
New York 26
District
D+11
Incumbent
Brian Higgins
Incumbent
Democratic
Incumbent
2004
Results
Incumbent re-elected.
Candidates
▌Y Brian Higgins (Democratic) 73.3% ▌Renee Zeno (Republican) 26.7%
New York 27
New York 27
District
New York 27
District
R+11
Incumbent
Chris Collins
Incumbent
Republican
Incumbent
2012
Results
Incumbent re-elected.
Candidates
▌Y Chris Collins (Republican) 49.1% ▌Nate McMurray (Democratic) 48.8% ▌Larry Piegza (Reform) 2.1%
District
Incumbent
Results
Candidates
Location
2017PVI
Representative
Party
Firstelected
New York 1
R+5
Lee Zeldin
Republican
2014
Incumbent re-elected.
▌Y Lee Zeldin (Republican) 51.5% ▌Perry Gershon (Democratic) 47.4% ▌Kate Browning (Women's Equality) 1.1%
New York 2
R+3
Peter King
Republican
1992
Incumbent re-elected.
▌Y Peter King (Republican) 53.1% ▌Liuba Grechen Shirley (Democratic) 46.9%
New York 3
D+1
Thomas Suozzi
Democratic
2016
Incumbent re-elected.
▌Y Thomas Suozzi (Democratic) 59.0% ▌Dan DeBono (Republican) 41.0%
New York 4
D+4
Kathleen Rice
Democratic
2014
Incumbent re-elected.
▌Y Kathleen Rice (Democratic) 61.3% ▌Ameer Benno (Republican) 38.7%
New York 5
D+37
Gregory Meeks
Democratic
1998
Incumbent re-elected.
▌Y Gregory Meeks (Democratic) Uncontested
New York 6
D+16
Grace Meng
Democratic
2012
Incumbent re-elected.
▌Y Grace Meng (Democratic) 90.9% ▌Tom Hillgardner (Green) 9.1%
New York 7
D+38
Nydia Velázquez
Democratic
1992
Incumbent re-elected.
▌Y Nydia Velázquez (Democratic) 93.4% ▌Joseph Lieberman (Conservative) 5.5% ▌Jeff Kurzon (Reform) 1.1%
New York 8
D+36
Hakeem Jeffries
Democratic
2012
Incumbent re-elected.
▌Y Hakeem Jeffries (Democratic) 94.2% ▌Ernest Johnson (Conservative) 5.2% ▌Jessica White (Reform) 0.5%
New York 9
D+34
Yvette Clarke
Democratic
2006
Incumbent re-elected.
▌Y Yvette Clarke (Democratic) 89.3% ▌Lutchi Gayot (Republican) 10.3% ▌Joel Anabilah-Azumah (Reform) 0.4%
New York 10
D+26
Jerry Nadler
Democratic
1992
Incumbent re-elected.
▌Y Jerry Nadler (Democratic) 82.1% ▌Naomi Levin (Republican) 17.9%
New York 11
R+3
Dan Donovan
Republican
2015 (special)
Incumbent lost re-election.Democratic gain.
▌Y Max Rose (Democratic) 53.0% ▌Dan Donovan (Republican) 46.6% ▌Henry Bardel (Green) 0.4%
New York 12
D+31
Carolyn Maloney
Democratic
1992
Incumbent re-elected.
▌Y Carolyn Maloney (Democratic) 86.4% ▌Eliot Rabin (Republican) 12.1% ▌Scott Hutchins (Green) 1.5%
New York 13
D+43
Adriano Espaillat
Democratic
2016
Incumbent re-elected.
▌Y Adriano Espaillat (Democratic) 94.6% ▌Jineea Butler (Republican) 5.4%
New York 14
D+29
Joe Crowley
Democratic
1998
Incumbent lost renomination, ran as Working Families nominee, and lost re-election.New member elected.Democratic hold.
▌Y Alexandria Ocasio-Cortez (Democratic) 78.2% ▌Anthony Pappas (Republican) 13.6% ▌Joe Crowley (Working Families) 6.6% ▌Elizabeth Perri (Conservative) 1.6%
New York 15
D+44
José E. Serrano
Democratic
1990
Incumbent re-elected.
▌Y José E. Serrano (Democratic) 96.0% ▌Jason Gonzalez (Republican) 4.0%
New York 16
D+24
Eliot Engel
Democratic
1988
Incumbent re-elected.
▌Y Eliot Engel (Democratic) Uncontested
New York 17
D+7
Nita Lowey
Democratic
1988
Incumbent re-elected.
▌Y Nita Lowey (Democratic) 88.0% ▌Joe Ciardullo (Reform) 12.0%
New York 18
R+1
Sean Patrick Maloney
Democratic
2012
Incumbent re-elected.
▌Y Sean Patrick Maloney (Democratic) 55.5% ▌James O'Donnell (Republican) 44.5%
New York 19
R+2
John Faso
Republican
2016
Incumbent lost re-election.Democratic gain.
▌Y Antonio Delgado (Democratic) 51.4% ▌John Faso (Republican) 46.2% ▌Steven Greenfield (Green) 1.5% ▌Diane Neal (Independent) 1.0%
New York 20
D+7
Paul Tonko
Democratic
2008
Incumbent re-elected.
▌Y Paul Tonko (Democratic) 66.5% ▌Joe Vitollo (Republican) 33.5%
New York 21
R+4
Elise Stefanik
Republican
2014
Incumbent re-elected.
▌Y Elise Stefanik (Republican) 56.1% ▌Tedra Cobb (Democratic) 42.4% ▌Lynn Kahn (Green) 1.5%
New York 22
R+6
Claudia Tenney
Republican
2016
Incumbent lost re-election.Democratic gain.
▌Y Anthony Brindisi (Democratic) 50.9% ▌Claudia Tenney (Republican) 49.1%
New York 23
R+6
Tom Reed
Republican
2010 (special)
Incumbent re-elected.
▌Y Tom Reed (Republican) 54.2% ▌Tracy Mitrano (Democratic) 45.8%
New York 24
D+3
John Katko
Republican
2014
Incumbent re-elected.
▌Y John Katko (Republican) 52.6% ▌Dana Balter (Democratic) 47.4%
New York 25
D+8
Vacant
Incumbent Louise Slaughter died March 16, 2018.Democratic hold.Winner was also elected to fill unexpired term, see above.
▌Y Joseph Morelle (Democratic) 59.0% ▌Jim Maxwell (Republican) 41.0%
New York 26
D+11
Brian Higgins
Democratic
2004
Incumbent re-elected.
▌Y Brian Higgins (Democratic) 73.3% ▌Renee Zeno (Republican) 26.7%
New York 27
R+11
Chris Collins
Republican
2012
Incumbent re-elected.
▌Y Chris Collins (Republican) 49.1% ▌Nate McMurray (Democratic) 48.8% ▌Larry Piegza (Reform) 2.1%
· North Carolina
Location
Location
District
Location
District
2017PVI
Incumbent
Representative
Incumbent
Party
Incumbent
Firstelected
North Carolina 1
North Carolina 1
District
North Carolina 1
District
D+17
Incumbent
G. K. Butterfield
Incumbent
Democratic
Incumbent
2004 (special)
Results
Incumbent re-elected.
Candidates
▌Y G. K. Butterfield (Democratic) 69.8% ▌Roger Allison (Republican) 30.2%
North Carolina 2
North Carolina 2
District
North Carolina 2
District
R+7
Incumbent
George Holding
Incumbent
Republican
Incumbent
2012
Results
Incumbent re-elected.
Candidates
▌Y George Holding (Republican) 51.3% ▌Linda Coleman (Democratic) 45.8% ▌Jeff Matemu (Libertarian) 2.9%
North Carolina 3
North Carolina 3
District
North Carolina 3
District
R+12
Incumbent
Walter B. Jones Jr.
Incumbent
Republican
Incumbent
1994
Results
Incumbent re-elected.
Candidates
▌Y Walter B. Jones Jr. (Republican) Uncontested
North Carolina 4
North Carolina 4
District
North Carolina 4
District
D+17
Incumbent
David Price
Incumbent
Democratic
Incumbent
19861994 (defeated)1996
Results
Incumbent re-elected.
Candidates
▌Y David Price (Democratic) 72.4% ▌Steve Von Loor (Republican) 24.0% ▌Barbara Howe (Libertarian) 3.6%
North Carolina 5
North Carolina 5
District
North Carolina 5
District
R+10
Incumbent
Virginia Foxx
Incumbent
Republican
Incumbent
2004
Results
Incumbent re-elected.
Candidates
▌Y Virginia Foxx (Republican) 57.0% ▌D. D. Adams (Democratic) 43.0%
North Carolina 6
North Carolina 6
District
North Carolina 6
District
R+9
Incumbent
Mark Walker
Incumbent
Republican
Incumbent
2014
Results
Incumbent re-elected.
Candidates
▌Y Mark Walker (Republican) 56.5% ▌Ryan Watts (Democratic) 43.5%
North Carolina 7
North Carolina 7
District
North Carolina 7
District
R+9
Incumbent
David Rouzer
Incumbent
Republican
Incumbent
2014
Results
Incumbent re-elected.
Candidates
▌Y David Rouzer (Republican) 55.5% ▌Kyle Horton (Democratic) 42.8% ▌David Fallin (Constitution) 1.6%
North Carolina 8
North Carolina 8
District
North Carolina 8
District
R+8
Incumbent
Richard Hudson
Incumbent
Republican
Incumbent
2012
Results
Incumbent re-elected.
Candidates
▌Y Richard Hudson (Republican) 55.3% ▌Frank McNeill (Democratic) 44.7%
North Carolina 9
North Carolina 9
District
North Carolina 9
District
R+8
Incumbent
Robert Pittenger
Incumbent
Republican
Incumbent
2012
Results
Incumbent lost renomination.Results void and new election ordered.Republican loss.
Candidates
▌Mark Harris (Republican) 49.3% ▌Dan McCready (Democratic) 48.9% ▌Jeff Scott (Libertarian) 1.8%
North Carolina 10
North Carolina 10
District
North Carolina 10
District
R+12
Incumbent
Patrick McHenry
Incumbent
Republican
Incumbent
2004
Results
Incumbent re-elected.
Candidates
▌Y Patrick McHenry (Republican) 59.3% ▌David Brown (Democratic) 40.7%
North Carolina 11
North Carolina 11
District
North Carolina 11
District
R+14
Incumbent
Mark Meadows
Incumbent
Republican
Incumbent
2012
Results
Incumbent re-elected.
Candidates
▌Y Mark Meadows (Republican) 59.2% ▌Phillip Price (Democratic) 38.7% ▌Clifton Ingram (Libertarian) 2.0%
North Carolina 12
North Carolina 12
District
North Carolina 12
District
D+18
Incumbent
Alma Adams
Incumbent
Democratic
Incumbent
2014
Results
Incumbent re-elected.
Candidates
▌Y Alma Adams (Democratic) 73.1% ▌Paul Wright (Republican) 26.9%
North Carolina 13
North Carolina 13
District
North Carolina 13
District
R+6
Incumbent
Ted Budd
Incumbent
Republican
Incumbent
2016
Results
Incumbent re-elected.
Candidates
▌Y Ted Budd (Republican) 51.5% ▌Kathy Manning (Democratic) 45.5% ▌Tom Bailey (Libertarian) 2.0%
District
Incumbent
Results
Candidates
Location
2017PVI
Representative
Party
Firstelected
North Carolina 1
D+17
G. K. Butterfield
Democratic
2004 (special)
Incumbent re-elected.
▌Y G. K. Butterfield (Democratic) 69.8% ▌Roger Allison (Republican) 30.2%
North Carolina 2
R+7
George Holding
Republican
2012
Incumbent re-elected.
▌Y George Holding (Republican) 51.3% ▌Linda Coleman (Democratic) 45.8% ▌Jeff Matemu (Libertarian) 2.9%
North Carolina 3
R+12
Walter B. Jones Jr.
Republican
1994
Incumbent re-elected.
▌Y Walter B. Jones Jr. (Republican) Uncontested
North Carolina 4
D+17
David Price
Democratic
19861994 (defeated)1996
Incumbent re-elected.
▌Y David Price (Democratic) 72.4% ▌Steve Von Loor (Republican) 24.0% ▌Barbara Howe (Libertarian) 3.6%
North Carolina 5
R+10
Virginia Foxx
Republican
2004
Incumbent re-elected.
▌Y Virginia Foxx (Republican) 57.0% ▌D. D. Adams (Democratic) 43.0%
North Carolina 6
R+9
Mark Walker
Republican
2014
Incumbent re-elected.
▌Y Mark Walker (Republican) 56.5% ▌Ryan Watts (Democratic) 43.5%
North Carolina 7
R+9
David Rouzer
Republican
2014
Incumbent re-elected.
▌Y David Rouzer (Republican) 55.5% ▌Kyle Horton (Democratic) 42.8% ▌David Fallin (Constitution) 1.6%
North Carolina 8
R+8
Richard Hudson
Republican
2012
Incumbent re-elected.
▌Y Richard Hudson (Republican) 55.3% ▌Frank McNeill (Democratic) 44.7%
North Carolina 9
R+8
Robert Pittenger
Republican
2012
Incumbent lost renomination.Results void and new election ordered.Republican loss.
▌Mark Harris (Republican) 49.3% ▌Dan McCready (Democratic) 48.9% ▌Jeff Scott (Libertarian) 1.8%
North Carolina 10
R+12
Patrick McHenry
Republican
2004
Incumbent re-elected.
▌Y Patrick McHenry (Republican) 59.3% ▌David Brown (Democratic) 40.7%
North Carolina 11
R+14
Mark Meadows
Republican
2012
Incumbent re-elected.
▌Y Mark Meadows (Republican) 59.2% ▌Phillip Price (Democratic) 38.7% ▌Clifton Ingram (Libertarian) 2.0%
North Carolina 12
D+18
Alma Adams
Democratic
2014
Incumbent re-elected.
▌Y Alma Adams (Democratic) 73.1% ▌Paul Wright (Republican) 26.9%
North Carolina 13
R+6
Ted Budd
Republican
2016
Incumbent re-elected.
▌Y Ted Budd (Republican) 51.5% ▌Kathy Manning (Democratic) 45.5% ▌Tom Bailey (Libertarian) 2.0%
· North Dakota
Location
Location
District
Location
District
2017PVI
Incumbent
Representative
Incumbent
Party
Incumbent
Firstelected
North Dakota at-large
District
North Dakota at-large
District
R+16
Incumbent
Kevin Cramer
Incumbent
Republican
Incumbent
2012
Results
Incumbent retired to run for U.S. Senator.Republican hold.
Candidates
▌Y Kelly Armstrong (Republican) 60.3% ▌Mac Schneider (Democratic-NPL) 35.6% ▌Charles Tuttle (Independent) 4.1%
District
Incumbent
Results
Candidates
Location
2017PVI
Representative
Party
Firstelected
North Dakota at-large
R+16
Kevin Cramer
Republican
2012
Incumbent retired to run for U.S. Senator.Republican hold.
▌Y Kelly Armstrong (Republican) 60.3% ▌Mac Schneider (Democratic-NPL) 35.6% ▌Charles Tuttle (Independent) 4.1%
· Ohio
Location
Location
District
Location
District
2017PVI
Incumbent
Representative
Incumbent
Party
Incumbent
Firstelected
Ohio 1
Ohio 1
District
Ohio 1
District
R+5
Incumbent
Steve Chabot
Incumbent
Republican
Incumbent
19942008 (defeated)2010
Results
Incumbent re-elected.
Candidates
▌Y Steve Chabot (Republican) 51.3% ▌Aftab Pureval (Democratic) 46.9% ▌Dirk Kubala (Libertarian) 1.8%
Ohio 2
Ohio 2
District
Ohio 2
District
R+9
Incumbent
Brad Wenstrup
Incumbent
Republican
Incumbent
2012
Results
Incumbent re-elected.
Candidates
▌Y Brad Wenstrup (Republican) 57.6% ▌Jill Schiller (Democratic) 41.2% ▌James Condit (Green) 1.2%
Ohio 3
Ohio 3
District
Ohio 3
District
D+19
Incumbent
Joyce Beatty
Incumbent
Democratic
Incumbent
2012
Results
Incumbent re-elected.
Candidates
▌Y Joyce Beatty (Democratic) 73.6% ▌James Burgess (Republican) 26.4%
Ohio 4
Ohio 4
District
Ohio 4
District
R+14
Incumbent
Jim Jordan
Incumbent
Republican
Incumbent
2006
Results
Incumbent re-elected.
Candidates
▌Y Jim Jordan (Republican) 65.3% ▌Janet Garrett (Democratic) 34.7%
Ohio 5
Ohio 5
District
Ohio 5
District
R+11
Incumbent
Bob Latta
Incumbent
Republican
Incumbent
2006
Results
Incumbent re-elected.
Candidates
▌Y Bob Latta (Republican) 62.3% ▌Michael Galbraith (Democratic) 35.1% ▌Don Kissick (Libertarian) 2.6%
Ohio 6
Ohio 6
District
Ohio 6
District
R+16
Incumbent
Bill Johnson
Incumbent
Republican
Incumbent
2010
Results
Incumbent re-elected.
Candidates
▌Y Bill Johnson (Republican) 69.3% ▌Shawna Roberts (Democratic) 30.7%
Ohio 7
Ohio 7
District
Ohio 7
District
R+12
Incumbent
Bob Gibbs
Incumbent
Republican
Incumbent
2010
Results
Incumbent re-elected.
Candidates
▌Y Bob Gibbs (Republican) 58.7% ▌Ken Harbaugh (Democratic) 41.3%
Ohio 8
Ohio 8
District
Ohio 8
District
R+17
Incumbent
Warren Davidson
Incumbent
Republican
Incumbent
2016 (special)
Results
Incumbent re-elected.
Candidates
▌Y Warren Davidson (Republican) 66.6% ▌Vanessa Enoch (Democratic) 33.4%
Ohio 9
Ohio 9
District
Ohio 9
District
D+14
Incumbent
Marcy Kaptur
Incumbent
Democratic
Incumbent
1982
Results
Incumbent re-elected.
Candidates
▌Y Marcy Kaptur (Democratic) 67.8% ▌Steve Kraus (Republican) 32.2%
Ohio 10
Ohio 10
District
Ohio 10
District
R+4
Incumbent
Mike Turner
Incumbent
Republican
Incumbent
2002
Results
Incumbent re-elected.
Candidates
▌Y Mike Turner (Republican) 55.9% ▌Theresa Gasper (Democratic) 42.2% ▌David Harlow (Libertarian) 1.9%
Ohio 11
Ohio 11
District
Ohio 11
District
D+32
Incumbent
Marcia Fudge
Incumbent
Democratic
Incumbent
2006
Results
Incumbent re-elected.
Candidates
▌Y Marcia Fudge (Democratic) 82.2% ▌Beverly Goldstein (Republican) 17.8%
Ohio 12
Ohio 12
District
Ohio 12
District
R+7
Incumbent
Troy Balderson
Incumbent
Republican
Incumbent
2018 (special)
Results
Incumbent re-elected.
Candidates
▌Y Troy Balderson (Republican) 51.4% ▌Danny O'Connor (Democratic) 47.2% ▌Joseph Manchik (Green) 1.4%
Ohio 13
Ohio 13
District
Ohio 13
District
D+7
Incumbent
Tim Ryan
Incumbent
Democratic
Incumbent
2002
Results
Incumbent re-elected.
Candidates
▌Y Tim Ryan (Democratic) 61.0% ▌Chris DePizzo (Republican) 39.0%
Ohio 14
Ohio 14
District
Ohio 14
District
R+5
Incumbent
David Joyce
Incumbent
Republican
Incumbent
2012
Results
Incumbent re-elected.
Candidates
▌Y David Joyce (Republican) 55.2% ▌Betsy Rader (Democratic) 44.8%
Ohio 15
Ohio 15
District
Ohio 15
District
R+7
Incumbent
Steve Stivers
Incumbent
Republican
Incumbent
2010
Results
Incumbent re-elected.
Candidates
▌Y Steve Stivers (Republican) 58.3% ▌Rick Neal (Democratic) 39.7% ▌Johnathan Miller (Libertarian) 2.0%
Ohio 16
Ohio 16
District
Ohio 16
District
R+8
Incumbent
Jim Renacci
Incumbent
Republican
Incumbent
2010
Results
Incumbent retired to run for U.S. Senator.Republican hold.
Candidates
▌Y Anthony Gonzalez (Republican) 56.7% ▌Susan Moran Palmer (Democratic) 43.3%
District
Incumbent
Results
Candidates
Location
2017PVI
Representative
Party
Firstelected
Ohio 1
R+5
Steve Chabot
Republican
19942008 (defeated)2010
Incumbent re-elected.
▌Y Steve Chabot (Republican) 51.3% ▌Aftab Pureval (Democratic) 46.9% ▌Dirk Kubala (Libertarian) 1.8%
Ohio 2
R+9
Brad Wenstrup
Republican
2012
Incumbent re-elected.
▌Y Brad Wenstrup (Republican) 57.6% ▌Jill Schiller (Democratic) 41.2% ▌James Condit (Green) 1.2%
Ohio 3
D+19
Joyce Beatty
Democratic
2012
Incumbent re-elected.
▌Y Joyce Beatty (Democratic) 73.6% ▌James Burgess (Republican) 26.4%
Ohio 4
R+14
Jim Jordan
Republican
2006
Incumbent re-elected.
▌Y Jim Jordan (Republican) 65.3% ▌Janet Garrett (Democratic) 34.7%
Ohio 5
R+11
Bob Latta
Republican
2006
Incumbent re-elected.
▌Y Bob Latta (Republican) 62.3% ▌Michael Galbraith (Democratic) 35.1% ▌Don Kissick (Libertarian) 2.6%
Ohio 6
R+16
Bill Johnson
Republican
2010
Incumbent re-elected.
▌Y Bill Johnson (Republican) 69.3% ▌Shawna Roberts (Democratic) 30.7%
Ohio 7
R+12
Bob Gibbs
Republican
2010
Incumbent re-elected.
▌Y Bob Gibbs (Republican) 58.7% ▌Ken Harbaugh (Democratic) 41.3%
Ohio 8
R+17
Warren Davidson
Republican
2016 (special)
Incumbent re-elected.
▌Y Warren Davidson (Republican) 66.6% ▌Vanessa Enoch (Democratic) 33.4%
Ohio 9
D+14
Marcy Kaptur
Democratic
1982
Incumbent re-elected.
▌Y Marcy Kaptur (Democratic) 67.8% ▌Steve Kraus (Republican) 32.2%
Ohio 10
R+4
Mike Turner
Republican
2002
Incumbent re-elected.
▌Y Mike Turner (Republican) 55.9% ▌Theresa Gasper (Democratic) 42.2% ▌David Harlow (Libertarian) 1.9%
Ohio 11
D+32
Marcia Fudge
Democratic
2006
Incumbent re-elected.
▌Y Marcia Fudge (Democratic) 82.2% ▌Beverly Goldstein (Republican) 17.8%
Ohio 12
R+7
Troy Balderson
Republican
2018 (special)
Incumbent re-elected.
▌Y Troy Balderson (Republican) 51.4% ▌Danny O'Connor (Democratic) 47.2% ▌Joseph Manchik (Green) 1.4%
Ohio 13
D+7
Tim Ryan
Democratic
2002
Incumbent re-elected.
▌Y Tim Ryan (Democratic) 61.0% ▌Chris DePizzo (Republican) 39.0%
Ohio 14
R+5
David Joyce
Republican
2012
Incumbent re-elected.
▌Y David Joyce (Republican) 55.2% ▌Betsy Rader (Democratic) 44.8%
Ohio 15
R+7
Steve Stivers
Republican
2010
Incumbent re-elected.
▌Y Steve Stivers (Republican) 58.3% ▌Rick Neal (Democratic) 39.7% ▌Johnathan Miller (Libertarian) 2.0%
Ohio 16
R+8
Jim Renacci
Republican
2010
Incumbent retired to run for U.S. Senator.Republican hold.
▌Y Anthony Gonzalez (Republican) 56.7% ▌Susan Moran Palmer (Democratic) 43.3%
· Oklahoma
Location
Location
District
Location
District
2017PVI
Incumbent
Representative
Incumbent
Party
Incumbent
Firstelected
Oklahoma 1
Oklahoma 1
District
Oklahoma 1
District
R+17
Incumbent
Vacant
Incumbent
Jim Bridenstine (R) resigned April 23, 2018 to become NASA Administrator.Republican hold.
Incumbent
▌Y Kevin Hern (Republican) 59.3% ▌Tim Gilpin (Democratic) 40.7%
Oklahoma 2
Oklahoma 2
District
Oklahoma 2
District
R+24
Incumbent
Markwayne Mullin
Incumbent
Republican
Incumbent
2012
Results
Incumbent re-elected.
Candidates
▌Y Markwayne Mullin (Republican) 65.0% ▌Jason Nichols (Democratic) 30.1% ▌John Foreman (Independent) 3.0% ▌Richard Castaldo (Libertarian) 1.9%
Oklahoma 3
Oklahoma 3
District
Oklahoma 3
District
R+27
Incumbent
Frank Lucas
Incumbent
Republican
Incumbent
1994
Results
Incumbent re-elected.
Candidates
▌Y Frank Lucas (Republican) 73.9% ▌Frankie Robbins (Democratic) 26.1%
Oklahoma 4
Oklahoma 4
District
Oklahoma 4
District
R+20
Incumbent
Tom Cole
Incumbent
Republican
Incumbent
2002
Results
Incumbent re-elected.
Candidates
▌Y Tom Cole (Republican) 63.1% ▌Mary Brannon (Democratic) 33.0% ▌Ruby Peters (Independent) 3.9%
Oklahoma 5
Oklahoma 5
District
Oklahoma 5
District
R+10
Incumbent
Steve Russell
Incumbent
Republican
Incumbent
2014
Results
Incumbent lost re-election.Democratic gain.
Candidates
▌Y Kendra Horn (Democratic) 50.7% ▌Steve Russell (Republican) 49.3%
District
Incumbent
Results
Candidates
Location
2017PVI
Representative
Party
Firstelected
Oklahoma 1
R+17
Vacant
Jim Bridenstine (R) resigned April 23, 2018 to become NASA Administrator.Republican hold.
▌Y Kevin Hern (Republican) 59.3% ▌Tim Gilpin (Democratic) 40.7%
Oklahoma 2
R+24
Markwayne Mullin
Republican
2012
Incumbent re-elected.
▌Y Markwayne Mullin (Republican) 65.0% ▌Jason Nichols (Democratic) 30.1% ▌John Foreman (Independent) 3.0% ▌Richard Castaldo (Libertarian) 1.9%
Oklahoma 3
R+27
Frank Lucas
Republican
1994
Incumbent re-elected.
▌Y Frank Lucas (Republican) 73.9% ▌Frankie Robbins (Democratic) 26.1%
Oklahoma 4
R+20
Tom Cole
Republican
2002
Incumbent re-elected.
▌Y Tom Cole (Republican) 63.1% ▌Mary Brannon (Democratic) 33.0% ▌Ruby Peters (Independent) 3.9%
Oklahoma 5
R+10
Steve Russell
Republican
2014
Incumbent lost re-election.Democratic gain.
▌Y Kendra Horn (Democratic) 50.7% ▌Steve Russell (Republican) 49.3%
· Oregon
Location
Location
District
Location
District
2017PVI
Incumbent
Representative
Incumbent
Party
Incumbent
Firstelected
Oregon 1
Oregon 1
District
Oregon 1
District
D+9
Incumbent
Suzanne Bonamici
Incumbent
Democratic
Incumbent
2012 (special)
Results
Incumbent re-elected.
Candidates
▌Y Suzanne Bonamici (Democratic) 63.7% ▌John Verbeek (Republican) 32.1% ▌Drew Layda (Pacific Green) 4.2%
Oregon 2
Oregon 2
District
Oregon 2
District
R+11
Incumbent
Greg Walden
Incumbent
Republican
Incumbent
1998
Results
Incumbent re-elected.
Candidates
▌Y Greg Walden (Republican) 56.3% ▌Jamie McLeod-Skinner (Democratic) 39.4% ▌Mark Roberts (Independent) 4.2%
Oregon 3
Oregon 3
District
Oregon 3
District
D+24
Incumbent
Earl Blumenauer
Incumbent
Democratic
Incumbent
1996
Results
Incumbent re-elected.
Candidates
▌Y Earl Blumenauer (Democratic) 72.7% ▌Tom Harrison (Republican) 19.9% ▌Marc Koller (Independent) 5.5% ▌Gary Dye (Libertarian) 1.5% ▌Michael Marsh (Constitution) 0.4%
Oregon 4
Oregon 4
District
Oregon 4
District
EVEN
Incumbent
Peter DeFazio
Incumbent
Democratic
Incumbent
1986
Results
Incumbent re-elected.
Candidates
▌Y Peter DeFazio (Democratic) 56.0% ▌Art Robinson (Republican) 40.9% ▌Mike Beilstein (Pacific Green) 1.6% ▌Richard Johnson (Libertarian) 1.4%
Oregon 5
Oregon 5
District
Oregon 5
District
EVEN
Incumbent
Kurt Schrader
Incumbent
Democratic
Incumbent
2008
Results
Incumbent re-elected.
Candidates
▌Y Kurt Schrader (Democratic) 55.1% ▌Mark Callahan (Republican) 41.9% ▌Dan Souza (Libertarian) 1.7% ▌Marvin Sandnes (Pacific Green) 1.3%
District
Incumbent
Results
Candidates
Location
2017PVI
Representative
Party
Firstelected
Oregon 1
D+9
Suzanne Bonamici
Democratic
2012 (special)
Incumbent re-elected.
▌Y Suzanne Bonamici (Democratic) 63.7% ▌John Verbeek (Republican) 32.1% ▌Drew Layda (Pacific Green) 4.2%
Oregon 2
R+11
Greg Walden
Republican
1998
Incumbent re-elected.
▌Y Greg Walden (Republican) 56.3% ▌Jamie McLeod-Skinner (Democratic) 39.4% ▌Mark Roberts (Independent) 4.2%
Oregon 3
D+24
Earl Blumenauer
Democratic
1996
Incumbent re-elected.
▌Y Earl Blumenauer (Democratic) 72.7% ▌Tom Harrison (Republican) 19.9% ▌Marc Koller (Independent) 5.5% ▌Gary Dye (Libertarian) 1.5% ▌Michael Marsh (Constitution) 0.4%
Oregon 4
EVEN
Peter DeFazio
Democratic
1986
Incumbent re-elected.
▌Y Peter DeFazio (Democratic) 56.0% ▌Art Robinson (Republican) 40.9% ▌Mike Beilstein (Pacific Green) 1.6% ▌Richard Johnson (Libertarian) 1.4%
Oregon 5
EVEN
Kurt Schrader
Democratic
2008
Incumbent re-elected.
▌Y Kurt Schrader (Democratic) 55.1% ▌Mark Callahan (Republican) 41.9% ▌Dan Souza (Libertarian) 1.7% ▌Marvin Sandnes (Pacific Green) 1.3%
· Pennsylvania
Location
Location
District
Location
District
2017PVI
Incumbent
Representative
Incumbent
Party
Incumbent
Firstelected
Pennsylvania 1
Pennsylvania 1
District
Pennsylvania 1
District
R+1
Incumbent
Brian Fitzpatrick Redistricted from the 8th district
Incumbent
Republican
Incumbent
2016
Results
Incumbent re-elected.
Candidates
▌Y Brian Fitzpatrick (Republican) 51.3% ▌Scott Wallace (Democratic) 48.7%
Pennsylvania 2
Pennsylvania 2
District
Pennsylvania 2
District
D+25
Incumbent
Brendan Boyle Redistricted from the 13th district
Incumbent
Democratic
Incumbent
2014
Results
Incumbent re-elected.
Candidates
▌Y Brendan Boyle (Democratic) 79.0% ▌David Torres (Republican) 21.0%
Bob Brady Redistricted from the 1st district
District
Bob Brady Redistricted from the 1st district
District
Democratic
Incumbent
1998 (special)
Incumbent
Incumbent retired.Democratic loss.
Pennsylvania 3
Pennsylvania 3
District
Pennsylvania 3
District
D+41
Incumbent
Dwight Evans Redistricted from the 2nd district
Incumbent
Democratic
Incumbent
2016
Results
Incumbent re-elected.
Candidates
▌Y Dwight Evans (Democratic) 93.4% ▌Bryan Leib (Republican) 6.6%
Pennsylvania 4
Pennsylvania 4
District
Pennsylvania 4
District
D+7
Incumbent
None (New seat)
Incumbent
New seat.Democratic gain.
Incumbent
▌Y Madeleine Dean (Democratic) 63.5% ▌Dan David (Republican) 36.5%
Pennsylvania 5
Pennsylvania 5
District
Pennsylvania 5
District
D+13
Incumbent
Vacant
Incumbent
Pat Meehan (R) resigned April 27, 2018, after being redistricted from the 7th district.Democratic gain.Winner was also elected to fill unexpired term, see above.
Incumbent
▌Y Mary Gay Scanlon (Democratic) 65.2% ▌Pearl Kim (Republican) 34.8%
Pennsylvania 6
Pennsylvania 6
District
Pennsylvania 6
District
D+2
Incumbent
Ryan Costello
Incumbent
Republican
Incumbent
2014
Results
Incumbent retired.Democratic gain.
Candidates
▌Y Chrissy Houlahan (Democratic) 58.9% ▌Greg McCauley (Republican) 41.1%
Pennsylvania 7
Pennsylvania 7
District
Pennsylvania 7
District
D+1
Incumbent
Vacant
Incumbent
Charlie Dent (R) resigned May 12, 2018, after being redistricted from the 15th district.Democratic gain.Winner was also elected to fill unexpired term, see above.
Incumbent
▌Y Susan Wild (Democratic) 53.5% ▌Marty Nothstein (Republican) 43.5% ▌Tom Silfies (Libertarian) 3.0%
Pennsylvania 8
Pennsylvania 8
District
Pennsylvania 8
District
R+1
Incumbent
Matt Cartwright Redistricted from the 17th district
Incumbent
Democratic
Incumbent
2012
Results
Incumbent re-elected.
Candidates
▌Y Matt Cartwright (Democratic) 54.6% ▌John Chrin (Republican) 45.4%
Pennsylvania 9
Pennsylvania 9
District
Pennsylvania 9
District
R+14
Incumbent
Lou Barletta Redistricted from the 11th district
Incumbent
Republican
Incumbent
2010
Results
Incumbent retired to run for U.S. Senator.Republican hold.
Candidates
▌Y Dan Meuser (Republican) 59.7% ▌Denny Wolff (Democratic) 40.3%
Pennsylvania 10
Pennsylvania 10
District
Pennsylvania 10
District
R+6
Incumbent
Scott Perry Redistricted from the 4th district
Incumbent
Republican
Incumbent
2012
Results
Incumbent re-elected.
Candidates
▌Y Scott Perry (Republican) 51.3% ▌George Scott (Democratic) 48.7%
Pennsylvania 11
Pennsylvania 11
District
Pennsylvania 11
District
R+14
Incumbent
Lloyd Smucker Redistricted from the 16th district
Incumbent
Republican
Incumbent
2016
Results
Incumbent re-elected.
Candidates
▌Y Lloyd Smucker (Republican) 59.0% ▌Jess King (Democratic) 41.0%
Pennsylvania 12
Pennsylvania 12
District
Pennsylvania 12
District
R+17
Incumbent
Tom Marino Redistricted from the 10th district
Incumbent
Republican
Incumbent
2010
Results
Incumbent re-elected.
Candidates
▌Y Tom Marino (Republican) 66.0% ▌Marc Friedenberg (Democratic) 34.0%
Pennsylvania 13
Pennsylvania 13
District
Pennsylvania 13
District
R+22
Incumbent
Bill Shuster Redistricted from the 9th district
Incumbent
Republican
Incumbent
2002
Results
Incumbent retired.Republican hold.
Candidates
▌Y John Joyce (Republican) 70.5% ▌Brent Ottaway (Democratic) 29.5%
Pennsylvania 14
Pennsylvania 14
District
Pennsylvania 14
District
R+14
Incumbent
None (New seat)
Incumbent
New seat.Republican gain.
Incumbent
▌Y Guy Reschenthaler (Republican) 57.9% ▌Bibiana Boerio (Democratic) 42.1%
Pennsylvania 15
Pennsylvania 15
District
Pennsylvania 15
District
R+20
Incumbent
Glenn Thompson Redistricted from the 5th district
Incumbent
Republican
Incumbent
2008
Results
Incumbent re-elected.
Candidates
▌Y Glenn Thompson (Republican) 67.8% ▌Susan Boser (Democratic) 32.2%
Pennsylvania 16
Pennsylvania 16
District
Pennsylvania 16
District
R+8
Incumbent
Mike Kelly Redistricted from the 3rd district
Incumbent
Republican
Incumbent
2010
Results
Incumbent re-elected.
Candidates
▌Y Mike Kelly (Republican) 51.6% ▌Ron DiNicola (Democratic) 47.3% ▌Bill Beeman (Libertarian) 1.1%
Pennsylvania 17
Pennsylvania 17
District
Pennsylvania 17
District
R+3
Incumbent
Conor Lamb Redistricted from the 18th district
Incumbent
Democratic
Incumbent
2018 (special)
Results
Incumbent re-elected.
Candidates
▌Y Conor Lamb (Democratic) 56.3% ▌Keith Rothfus (Republican) 43.7%
Keith Rothfus Redistricted from the 12th district
District
Keith Rothfus Redistricted from the 12th district
District
Republican
Incumbent
2012
Incumbent
Incumbent lost re-election.Republican loss.
Pennsylvania 18
Pennsylvania 18
District
Pennsylvania 18
District
D+13
Incumbent
Mike Doyle Redistricted from the 14th district
Incumbent
Democratic
Incumbent
1994
Results
Incumbent re-elected.
Candidates
▌Y Mike Doyle (Democratic) 100%
District
Incumbent
Results
Candidates
Location
2017PVI
Representative
Party
Firstelected
Pennsylvania 1
R+1
Brian Fitzpatrick Redistricted from the 8th district
Republican
2016
Incumbent re-elected.
▌Y Brian Fitzpatrick (Republican) 51.3% ▌Scott Wallace (Democratic) 48.7%
Pennsylvania 2
D+25
Brendan Boyle Redistricted from the 13th district
Democratic
2014
Incumbent re-elected.
▌Y Brendan Boyle (Democratic) 79.0% ▌David Torres (Republican) 21.0%
Bob Brady Redistricted from the 1st district
Democratic
1998 (special)
Incumbent retired.Democratic loss.
Pennsylvania 3
D+41
Dwight Evans Redistricted from the 2nd district
Democratic
2016
Incumbent re-elected.
▌Y Dwight Evans (Democratic) 93.4% ▌Bryan Leib (Republican) 6.6%
Pennsylvania 4
D+7
None (New seat)
New seat.Democratic gain.
▌Y Madeleine Dean (Democratic) 63.5% ▌Dan David (Republican) 36.5%
Pennsylvania 5
D+13
Vacant
Pat Meehan (R) resigned April 27, 2018, after being redistricted from the 7th district.Democratic gain.Winner was also elected to fill unexpired term, see above.
▌Y Mary Gay Scanlon (Democratic) 65.2% ▌Pearl Kim (Republican) 34.8%
Pennsylvania 6
D+2
Ryan Costello
Republican
2014
Incumbent retired.Democratic gain.
▌Y Chrissy Houlahan (Democratic) 58.9% ▌Greg McCauley (Republican) 41.1%
Pennsylvania 7
D+1
Vacant
Charlie Dent (R) resigned May 12, 2018, after being redistricted from the 15th district.Democratic gain.Winner was also elected to fill unexpired term, see above.
▌Y Susan Wild (Democratic) 53.5% ▌Marty Nothstein (Republican) 43.5% ▌Tom Silfies (Libertarian) 3.0%
Pennsylvania 8
R+1
Matt Cartwright Redistricted from the 17th district
Democratic
2012
Incumbent re-elected.
▌Y Matt Cartwright (Democratic) 54.6% ▌John Chrin (Republican) 45.4%
Pennsylvania 9
R+14
Lou Barletta Redistricted from the 11th district
Republican
2010
Incumbent retired to run for U.S. Senator.Republican hold.
▌Y Dan Meuser (Republican) 59.7% ▌Denny Wolff (Democratic) 40.3%
Pennsylvania 10
R+6
Scott Perry Redistricted from the 4th district
Republican
2012
Incumbent re-elected.
▌Y Scott Perry (Republican) 51.3% ▌George Scott (Democratic) 48.7%
Pennsylvania 11
R+14
Lloyd Smucker Redistricted from the 16th district
Republican
2016
Incumbent re-elected.
▌Y Lloyd Smucker (Republican) 59.0% ▌Jess King (Democratic) 41.0%
Pennsylvania 12
R+17
Tom Marino Redistricted from the 10th district
Republican
2010
Incumbent re-elected.
▌Y Tom Marino (Republican) 66.0% ▌Marc Friedenberg (Democratic) 34.0%
Pennsylvania 13
R+22
Bill Shuster Redistricted from the 9th district
Republican
2002
Incumbent retired.Republican hold.
▌Y John Joyce (Republican) 70.5% ▌Brent Ottaway (Democratic) 29.5%
Pennsylvania 14
R+14
None (New seat)
New seat.Republican gain.
▌Y Guy Reschenthaler (Republican) 57.9% ▌Bibiana Boerio (Democratic) 42.1%
Pennsylvania 15
R+20
Glenn Thompson Redistricted from the 5th district
Republican
2008
Incumbent re-elected.
▌Y Glenn Thompson (Republican) 67.8% ▌Susan Boser (Democratic) 32.2%
Pennsylvania 16
R+8
Mike Kelly Redistricted from the 3rd district
Republican
2010
Incumbent re-elected.
▌Y Mike Kelly (Republican) 51.6% ▌Ron DiNicola (Democratic) 47.3% ▌Bill Beeman (Libertarian) 1.1%
Pennsylvania 17
R+3
Conor Lamb Redistricted from the 18th district
Democratic
2018 (special)
Incumbent re-elected.
▌Y Conor Lamb (Democratic) 56.3% ▌Keith Rothfus (Republican) 43.7%
Keith Rothfus Redistricted from the 12th district
Republican
2012
Incumbent lost re-election.Republican loss.
Pennsylvania 18
D+13
Mike Doyle Redistricted from the 14th district
Democratic
1994
Incumbent re-elected.
▌Y Mike Doyle (Democratic) 100%
· Rhode Island
Location
Location
District
Location
District
2017PVI
Incumbent
Representative
Incumbent
Party
Incumbent
Firstelected
Rhode Island 1
Rhode Island 1
District
Rhode Island 1
District
D+16
Incumbent
David Cicilline
Incumbent
Democratic
Incumbent
2010
Results
Incumbent re-elected.
Candidates
▌Y David Cicilline (Democratic) 66.9% ▌Patrick Donovan (Republican) 33.1%
Rhode Island 2
Rhode Island 2
District
Rhode Island 2
District
D+6
Incumbent
James Langevin
Incumbent
Democratic
Incumbent
2000
Results
Incumbent re-elected.
Candidates
▌Y James Langevin (Democratic) 63.6% ▌Sal Caiozzo (Republican) 36.4%
District
Incumbent
Results
Candidates
Location
2017PVI
Representative
Party
Firstelected
Rhode Island 1
D+16
David Cicilline
Democratic
2010
Incumbent re-elected.
▌Y David Cicilline (Democratic) 66.9% ▌Patrick Donovan (Republican) 33.1%
Rhode Island 2
D+6
James Langevin
Democratic
2000
Incumbent re-elected.
▌Y James Langevin (Democratic) 63.6% ▌Sal Caiozzo (Republican) 36.4%
· South Carolina
Location
Location
District
Location
District
2017PVI
Incumbent
Representative
Incumbent
Party
Incumbent
Firstelected
South Carolina 1
South Carolina 1
District
South Carolina 1
District
R+10
Incumbent
Mark Sanford
Incumbent
Republican
Incumbent
19942000 (retired)2013 (special)
Results
Incumbent lost renomination.Democratic gain.
Candidates
▌Y Joe Cunningham (Democratic) 50.7% ▌Katie Arrington (Republican) 49.3%
South Carolina 2
South Carolina 2
District
South Carolina 2
District
R+12
Incumbent
Joe Wilson
Incumbent
Republican
Incumbent
2001 (special)
Results
Incumbent re-elected.
Candidates
▌Y Joe Wilson (Republican) 56.3% ▌Sean Carrigan (Democratic) 42.5% ▌Sonny Narang (American) 1.2%
South Carolina 3
South Carolina 3
District
South Carolina 3
District
R+19
Incumbent
Jeff Duncan
Incumbent
Republican
Incumbent
2010
Results
Incumbent re-elected.
Candidates
▌Y Jeff Duncan (Republican) 67.8% ▌Mary Geren (Democratic) 31.0% ▌Dave Moore (American) 1.2%
South Carolina 4
South Carolina 4
District
South Carolina 4
District
R+15
Incumbent
Trey Gowdy
Incumbent
Republican
Incumbent
2010
Results
Incumbent retired.Republican hold.
Candidates
▌Y William Timmons (Republican) 59.6% ▌Brandon Brown (Democratic) 36.6% ▌Guy Furay (American) 3.8%
South Carolina 5
South Carolina 5
District
South Carolina 5
District
R+9
Incumbent
Ralph Norman
Incumbent
Republican
Incumbent
2017 (special)
Results
Incumbent re-elected.
Candidates
▌Y Ralph Norman (Republican) 57.1% ▌Archie Parnell (Democratic) 41.5% ▌Michael Chandler (Constitution) 1.4%
South Carolina 6
South Carolina 6
District
South Carolina 6
District
D+19
Incumbent
Jim Clyburn
Incumbent
Democratic
Incumbent
1992
Results
Incumbent re-elected.
Candidates
▌Y Jim Clyburn (Democratic) 70.2% ▌Gerhard Gressmann (Republican) 28.3% ▌Bryan Pugh (Green) 1.5%
South Carolina 7
South Carolina 7
District
South Carolina 7
District
R+9
Incumbent
Tom Rice
Incumbent
Republican
Incumbent
2012
Results
Incumbent re-elected.
Candidates
▌Y Tom Rice (Republican) 59.6% ▌Robert Williams (Democratic) 40.4%
District
Incumbent
Results
Candidates
Location
2017PVI
Representative
Party
Firstelected
South Carolina 1
R+10
Mark Sanford
Republican
19942000 (retired)2013 (special)
Incumbent lost renomination.Democratic gain.
▌Y Joe Cunningham (Democratic) 50.7% ▌Katie Arrington (Republican) 49.3%
South Carolina 2
R+12
Joe Wilson
Republican
2001 (special)
Incumbent re-elected.
▌Y Joe Wilson (Republican) 56.3% ▌Sean Carrigan (Democratic) 42.5% ▌Sonny Narang (American) 1.2%
South Carolina 3
R+19
Jeff Duncan
Republican
2010
Incumbent re-elected.
▌Y Jeff Duncan (Republican) 67.8% ▌Mary Geren (Democratic) 31.0% ▌Dave Moore (American) 1.2%
South Carolina 4
R+15
Trey Gowdy
Republican
2010
Incumbent retired.Republican hold.
▌Y William Timmons (Republican) 59.6% ▌Brandon Brown (Democratic) 36.6% ▌Guy Furay (American) 3.8%
South Carolina 5
R+9
Ralph Norman
Republican
2017 (special)
Incumbent re-elected.
▌Y Ralph Norman (Republican) 57.1% ▌Archie Parnell (Democratic) 41.5% ▌Michael Chandler (Constitution) 1.4%
South Carolina 6
D+19
Jim Clyburn
Democratic
1992
Incumbent re-elected.
▌Y Jim Clyburn (Democratic) 70.2% ▌Gerhard Gressmann (Republican) 28.3% ▌Bryan Pugh (Green) 1.5%
South Carolina 7
R+9
Tom Rice
Republican
2012
Incumbent re-elected.
▌Y Tom Rice (Republican) 59.6% ▌Robert Williams (Democratic) 40.4%
· South Dakota
Location
Location
District
Location
District
2017PVI
Incumbent
Representative
Incumbent
Party
Incumbent
Firstelected
South Dakota at-large
District
South Dakota at-large
District
R+14
Incumbent
Kristi Noem
Incumbent
Republican
Incumbent
2010
Results
Incumbent retired to run for Governor of South Dakota.Republican hold.
Candidates
▌Y Dusty Johnson (Republican) 60.3% ▌Tim Bjorkman (Democratic) 36.0% ▌Ron Wieczorek (Independent) 2.2% ▌George Hendrickson (Libertarian) 1.5%
District
Incumbent
Results
Candidates
Location
2017PVI
Representative
Party
Firstelected
South Dakota at-large
R+14
Kristi Noem
Republican
2010
Incumbent retired to run for Governor of South Dakota.Republican hold.
▌Y Dusty Johnson (Republican) 60.3% ▌Tim Bjorkman (Democratic) 36.0% ▌Ron Wieczorek (Independent) 2.2% ▌George Hendrickson (Libertarian) 1.5%
· Tennessee
Location
Location
District
Location
District
2017PVI
Incumbent
Representative
Incumbent
Party
Incumbent
Firstelected
Tennessee 1
Tennessee 1
District
Tennessee 1
District
R+28
Incumbent
Phil Roe
Incumbent
Republican
Incumbent
2008
Results
Incumbent re-elected.
Candidates
▌Y Phil Roe (Republican) 77.1% ▌Marty Olsen (Democratic) 21.0% ▌Michael Salyer (Independent) 1.9%
Tennessee 2
Tennessee 2
District
Tennessee 2
District
R+20
Incumbent
Jimmy Duncan
Incumbent
Republican
Incumbent
1988 (special)
Results
Incumbent retired.Republican hold.
Candidates
▌Y Tim Burchett (Republican) 65.9% ▌Renee Hoyos (Democratic) 33.1% Others ▌Greg Samples (Libertarian) 0.4% ▌Jeffrey Grunau (Independent) 0.3% ▌Marc Whitmire (Independent) 0.2% ▌Keith LaTorre (Independent) 0.1%
Tennessee 3
Tennessee 3
District
Tennessee 3
District
R+18
Incumbent
Chuck Fleischmann
Incumbent
Republican
Incumbent
2010
Results
Incumbent re-elected.
Candidates
▌Y Chuck Fleischmann (Republican) 63.7% ▌Danielle Mitchell (Democratic) 34.5% ▌Rick Tyler (Independent) 1.8%
Tennessee 4
Tennessee 4
District
Tennessee 4
District
R+20
Incumbent
Scott DesJarlais
Incumbent
Republican
Incumbent
2010
Results
Incumbent re-elected.
Candidates
▌Y Scott DesJarlais (Republican) 63.4% ▌Mariah Phillips (Democratic) 33.6% ▌Michael Shupe (Independent) 3.0%
Tennessee 5
Tennessee 5
District
Tennessee 5
District
D+7
Incumbent
Jim Cooper
Incumbent
Democratic
Incumbent
19821994 (retired)2002
Results
Incumbent re-elected.
Candidates
▌Y Jim Cooper (Democratic) 67.8% ▌Jody Ball (Republican) 32.2%
Tennessee 6
Tennessee 6
District
Tennessee 6
District
R+24
Incumbent
Diane Black
Incumbent
Republican
Incumbent
2010
Results
Incumbent retired to run for Governor of Tennessee.Republican hold.
Candidates
▌Y John Rose (Republican) 69.5% ▌Dawn Barlow (Democratic) 28.3% ▌David Ross (Libertarian) 1.4% ▌Lloyd Dunn (Independent) 0.9%
Tennessee 7
Tennessee 7
District
Tennessee 7
District
R+20
Incumbent
Marsha Blackburn
Incumbent
Republican
Incumbent
2002
Results
Incumbent retired to run for U.S. Senator.Republican hold.
Candidates
▌Y Mark Green (Republican) 66.9% ▌Justin Kanew (Democratic) 32.1% Others ▌Lenny Ladner (Independent) 0.6% ▌Brent Legendre (Independent) 0.4%
Tennessee 8
Tennessee 8
District
Tennessee 8
District
R+19
Incumbent
David Kustoff
Incumbent
Republican
Incumbent
2016
Results
Incumbent re-elected.
Candidates
▌Y David Kustoff (Republican) 67.7% ▌Erika Stotts Pearson (Democratic) 30.1% ▌James Hart (Independent) 2.2%
Tennessee 9
Tennessee 9
District
Tennessee 9
District
D+28
Incumbent
Steve Cohen
Incumbent
Democratic
Incumbent
2006
Results
Incumbent re-elected.
Candidates
▌Y Steve Cohen (Democratic) 80.0% ▌Charlotte Bergmann (Republican) 19.2% ▌Leo AwGoWhat (Independent) 0.8%
District
Incumbent
Results
Candidates
Location
2017PVI
Representative
Party
Firstelected
Tennessee 1
R+28
Phil Roe
Republican
2008
Incumbent re-elected.
▌Y Phil Roe (Republican) 77.1% ▌Marty Olsen (Democratic) 21.0% ▌Michael Salyer (Independent) 1.9%
Tennessee 2
R+20
Jimmy Duncan
Republican
1988 (special)
Incumbent retired.Republican hold.
▌Y Tim Burchett (Republican) 65.9% ▌Renee Hoyos (Democratic) 33.1% Others ▌Greg Samples (Libertarian) 0.4% ▌Jeffrey Grunau (Independent) 0.3% ▌Marc Whitmire (Independent) 0.2% ▌Keith LaTorre (Independent) 0.1%
Tennessee 3
R+18
Chuck Fleischmann
Republican
2010
Incumbent re-elected.
▌Y Chuck Fleischmann (Republican) 63.7% ▌Danielle Mitchell (Democratic) 34.5% ▌Rick Tyler (Independent) 1.8%
Tennessee 4
R+20
Scott DesJarlais
Republican
2010
Incumbent re-elected.
▌Y Scott DesJarlais (Republican) 63.4% ▌Mariah Phillips (Democratic) 33.6% ▌Michael Shupe (Independent) 3.0%
Tennessee 5
D+7
Jim Cooper
Democratic
19821994 (retired)2002
Incumbent re-elected.
▌Y Jim Cooper (Democratic) 67.8% ▌Jody Ball (Republican) 32.2%
Tennessee 6
R+24
Diane Black
Republican
2010
Incumbent retired to run for Governor of Tennessee.Republican hold.
▌Y John Rose (Republican) 69.5% ▌Dawn Barlow (Democratic) 28.3% ▌David Ross (Libertarian) 1.4% ▌Lloyd Dunn (Independent) 0.9%
Tennessee 7
R+20
Marsha Blackburn
Republican
2002
Incumbent retired to run for U.S. Senator.Republican hold.
▌Y Mark Green (Republican) 66.9% ▌Justin Kanew (Democratic) 32.1% Others ▌Lenny Ladner (Independent) 0.6% ▌Brent Legendre (Independent) 0.4%
Tennessee 8
R+19
David Kustoff
Republican
2016
Incumbent re-elected.
▌Y David Kustoff (Republican) 67.7% ▌Erika Stotts Pearson (Democratic) 30.1% ▌James Hart (Independent) 2.2%
Tennessee 9
D+28
Steve Cohen
Democratic
2006
Incumbent re-elected.
▌Y Steve Cohen (Democratic) 80.0% ▌Charlotte Bergmann (Republican) 19.2% ▌Leo AwGoWhat (Independent) 0.8%
· Texas
Location
Location
District
Location
District
2017PVI
Incumbent
Representative
Incumbent
Party
Incumbent
Firstelected
Texas 1
Texas 1
District
Texas 1
District
R+25
Incumbent
Louie Gohmert
Incumbent
Republican
Incumbent
2004
Results
Incumbent re-elected.
Candidates
▌Y Louie Gohmert (Republican) 72.3% ▌Shirley McKellar (Democratic) 26.3% ▌Jeff Callaway (Libertarian) 1.4%
Texas 2
Texas 2
District
Texas 2
District
R+11
Incumbent
Ted Poe
Incumbent
Republican
Incumbent
2004
Results
Incumbent retired.Republican hold.
Candidates
▌Y Dan Crenshaw (Republican) 52.8% ▌Todd Litton (Democratic) 45.6% ▌Patrick Gunnels (Libertarian) 0.9% ▌Scott Cubbler (Independent) 0.7%
Texas 3
Texas 3
District
Texas 3
District
R+13
Incumbent
Sam Johnson
Incumbent
Republican
Incumbent
1991 (special)
Results
Incumbent retired.Republican hold.
Candidates
▌Y Van Taylor (Republican) 54.3% ▌Lorie Burch (Democratic) 44.3% ▌Christopher Claytor (Libertarian) 1.4%
Texas 4
Texas 4
District
Texas 4
District
R+28
Incumbent
John Ratcliffe
Incumbent
Republican
Incumbent
2014
Results
Incumbent re-elected.
Candidates
▌Y John Ratcliffe (Republican) 75.7% ▌Catherine Krantz (Democratic) 23.0% ▌Ken Ashby (Libertarian) 1.3%
Texas 5
Texas 5
District
Texas 5
District
R+16
Incumbent
Jeb Hensarling
Incumbent
Republican
Incumbent
2002
Results
Incumbent retired.Republican hold.
Candidates
▌Y Lance Gooden (Republican) 62.4% ▌Dan Wood (Democratic) 37.6%
Texas 6
Texas 6
District
Texas 6
District
R+9
Incumbent
Joe Barton
Incumbent
Republican
Incumbent
1984
Results
Incumbent retired.Republican hold.
Candidates
▌Y Ron Wright (Republican) 53.1% ▌Jana Lynne Sanchez (Democratic) 45.4% ▌Jason Allen Harber (Libertarian) 1.5%
Texas 7
Texas 7
District
Texas 7
District
R+7
Incumbent
John Culberson
Incumbent
Republican
Incumbent
2000
Results
Incumbent lost re-election.Democratic gain.
Candidates
▌Y Lizzie Fletcher (Democratic) 52.5% ▌John Culberson (Republican) 47.5%
Texas 8
Texas 8
District
Texas 8
District
R+28
Incumbent
Kevin Brady
Incumbent
Republican
Incumbent
1996
Results
Incumbent re-elected.
Candidates
▌Y Kevin Brady (Republican) 73.4% ▌Steven David (Democratic) 24.9% ▌Chris Duncan (Libertarian) 1.7%
Texas 9
Texas 9
District
Texas 9
District
D+29
Incumbent
Al Green
Incumbent
Democratic
Incumbent
2004
Results
Incumbent re-elected.
Candidates
▌Y Al Green (Democratic) 89.1% ▌Phil Kurtz (Libertarian) 3.9% ▌Benjamin Hernandez (Independent) 3.8% ▌Kesha Rogers (Independent) 3.3%
Texas 10
Texas 10
District
Texas 10
District
R+9
Incumbent
Michael McCaul
Incumbent
Republican
Incumbent
2004
Results
Incumbent re-elected.
Candidates
▌Y Michael McCaul (Republican) 51.1% ▌Mike Siegel (Democratic) 46.8% ▌Mike Ryan (Libertarian) 2.1%
Texas 11
Texas 11
District
Texas 11
District
R+32
Incumbent
Mike Conaway
Incumbent
Republican
Incumbent
2004
Results
Incumbent re-elected.
Candidates
▌Y Mike Conaway (Republican) 80.1% ▌Jennie Lou Leeder (Democratic) 18.4% ▌Rhett Rosenquest Smith (Libertarian) 1.5%
Texas 12
Texas 12
District
Texas 12
District
R+18
Incumbent
Kay Granger
Incumbent
Republican
Incumbent
1996
Results
Incumbent re-elected.
Candidates
▌Y Kay Granger (Republican) 64.3% ▌Vanessa Adia (Democratic) 33.9% ▌Jacob Leddy (Libertarian) 1.8%
Texas 13
Texas 13
District
Texas 13
District
R+33
Incumbent
Mac Thornberry
Incumbent
Republican
Incumbent
1994
Results
Incumbent re-elected.
Candidates
▌Y Mac Thornberry (Republican) 81.5% ▌Greg Sagan (Democratic) 16.9% ▌Calvin DeWeese (Libertarian) 1.6%
Texas 14
Texas 14
District
Texas 14
District
R+12
Incumbent
Randy Weber
Incumbent
Republican
Incumbent
2012
Results
Incumbent re-elected.
Candidates
▌Y Randy Weber (Republican) 59.2% ▌Adrienne Bell (Democratic) 39.3% ▌Don Conley (Libertarian) 1.4%
Texas 15
Texas 15
District
Texas 15
District
D+7
Incumbent
Vicente Gonzalez
Incumbent
Democratic
Incumbent
2016
Results
Incumbent re-elected.
Candidates
▌Y Vicente Gonzalez (Democratic) 59.7% ▌Tim Westley (Republican) 38.8% ▌Anthony Cristo (Libertarian) 1.5%
Texas 16
Texas 16
District
Texas 16
District
D+17
Incumbent
Beto O'Rourke
Incumbent
Democratic
Incumbent
2012
Results
Incumbent retired to run for U.S. Senator.Democratic hold.
Candidates
▌Y Veronica Escobar (Democratic) 68.5% ▌Rick Seeberger (Republican) 27.0% ▌Ben Mendoza (Independent) 1.6%
Texas 17
Texas 17
District
Texas 17
District
R+12
Incumbent
Bill Flores
Incumbent
Republican
Incumbent
2010
Results
Incumbent re-elected.
Candidates
▌Y Bill Flores (Republican) 56.8% ▌Rick Kennedy (Democratic) 41.3% ▌Peter Churchman (Libertarian) 1.9%
Texas 18
Texas 18
District
Texas 18
District
D+27
Incumbent
Sheila Jackson Lee
Incumbent
Democratic
Incumbent
1994
Results
Incumbent re-elected.
Candidates
▌Y Sheila Jackson Lee (Democratic) 75.2% ▌Ava Pate (Republican) 20.8% ▌Luke Spencer (Libertarian) 2.2%
Texas 19
Texas 19
District
Texas 19
District
R+27
Incumbent
Jodey Arrington
Incumbent
Republican
Incumbent
2016
Results
Incumbent re-elected.
Candidates
▌Y Jodey Arrington (Republican) 75.2% ▌Miguel Levario (Democratic) 24.8%
Texas 20
Texas 20
District
Texas 20
District
D+10
Incumbent
Joaquin Castro
Incumbent
Democratic
Incumbent
2012
Results
Incumbent re-elected.
Candidates
▌Y Joaquin Castro (Democratic) 80.9% ▌Jeffrey C. Blunt (Libertarian) 19.1%
Texas 21
Texas 21
District
Texas 21
District
R+10
Incumbent
Lamar Smith
Incumbent
Republican
Incumbent
1986
Results
Incumbent retired.Republican hold.
Candidates
▌Y Chip Roy (Republican) 50.2% ▌Joseph Kopser (Democratic) 47.6% ▌Lee Santos (Libertarian) 2.1%
Texas 22
Texas 22
District
Texas 22
District
R+10
Incumbent
Pete Olson
Incumbent
Republican
Incumbent
2008
Results
Incumbent re-elected.
Candidates
▌Y Pete Olson (Republican) 51.4% ▌Sri Preston Kulkarni (Democratic) 46.5% ▌John McElligott (Libertarian) 1.1% ▌Kellen Sweny (Independent) 1.1%
Texas 23
Texas 23
District
Texas 23
District
R+1
Incumbent
Will Hurd
Incumbent
Republican
Incumbent
2014
Results
Incumbent re-elected.
Candidates
▌Y Will Hurd (Republican) 49.2% ▌Gina Ortiz Jones (Democratic) 48.7% ▌Ruben Corvalan (Libertarian) 2.1%
Texas 24
Texas 24
District
Texas 24
District
R+9
Incumbent
Kenny Marchant
Incumbent
Republican
Incumbent
2004
Results
Incumbent re-elected.
Candidates
▌Y Kenny Marchant (Republican) 50.6% ▌Jan McDowell (Democratic) 47.5% ▌Mike Kolls (Libertarian) 1.8%
Texas 25
Texas 25
District
Texas 25
District
R+11
Incumbent
Roger Williams
Incumbent
Republican
Incumbent
2012
Results
Incumbent re-elected.
Candidates
▌Y Roger Williams (Republican) 53.5% ▌Julie Oliver (Democratic) 44.8% ▌Desarae Lindsey (Libertarian) 1.7%
Texas 26
Texas 26
District
Texas 26
District
R+18
Incumbent
Michael C. Burgess
Incumbent
Republican
Incumbent
2002
Results
Incumbent re-elected.
Candidates
▌Y Michael C. Burgess (Republican) 59.4% ▌Linsey Fagan (Democratic) 39.0% ▌Mark Boler (Libertarian) 1.6%
Texas 27
Texas 27
District
Texas 27
District
R+13
Incumbent
Michael Cloud
Incumbent
Republican
Incumbent
2018 (special)
Results
Incumbent re-elected.
Candidates
▌Y Michael Cloud (Republican) 60.3% ▌Eric Holguin (Democratic) 36.6% ▌James Duerr (Independent) 2.1% ▌Daniel Tinus (Libertarian) 1.0%
Texas 28
Texas 28
District
Texas 28
District
D+9
Incumbent
Henry Cuellar
Incumbent
Democratic
Incumbent
2004
Results
Incumbent re-elected.
Candidates
▌Y Henry Cuellar (Democratic) 84.4% ▌Arthur Thomas (Libertarian) 15.6%
Texas 29
Texas 29
District
Texas 29
District
D+19
Incumbent
Gene Green
Incumbent
Democratic
Incumbent
1992
Results
Incumbent retired.Democratic hold.
Candidates
▌Y Sylvia Garcia (Democratic) 75.1% ▌Phillip Aronoff (Republican) 23.9% ▌Cullen Burns (Libertarian) 1.0%
Texas 30
Texas 30
District
Texas 30
District
D+29
Incumbent
Eddie Bernice Johnson
Incumbent
Democratic
Incumbent
1992
Results
Incumbent re-elected.
Candidates
▌Y Eddie Bernice Johnson (Democratic) 91.1% ▌Shawn Jones (Libertarian) 8.9%
Texas 31
Texas 31
District
Texas 31
District
R+10
Incumbent
John Carter
Incumbent
Republican
Incumbent
2002
Results
Incumbent re-elected.
Candidates
▌Y John Carter (Republican) 50.6% ▌MJ Hegar (Democratic) 47.7% ▌Jason Hope (Libertarian) 1.7%
Texas 32
Texas 32
District
Texas 32
District
R+5
Incumbent
Pete Sessions
Incumbent
Republican
Incumbent
1996
Results
Incumbent lost re-election.Democratic gain.
Candidates
▌Y Colin Allred (Democratic) 52.3% ▌Pete Sessions (Republican) 45.8% ▌Melina Baker (Libertarian) 2.0%
Texas 33
Texas 33
District
Texas 33
District
D+23
Incumbent
Marc Veasey
Incumbent
Democratic
Incumbent
2012
Results
Incumbent re-elected.
Candidates
▌Y Marc Veasey (Democratic) 76.2% ▌Willie Billups (Republican) 21.9% ▌Jason Reeves (Libertarian) 1.9%
Texas 34
Texas 34
District
Texas 34
District
D+10
Incumbent
Filemon Vela Jr.
Incumbent
Democratic
Incumbent
2012
Results
Incumbent re-elected.
Candidates
▌Y Filemon Vela Jr. (Democratic) 60.0% ▌Rey Gonzalez (Republican) 40.0%
Texas 35
Texas 35
District
Texas 35
District
D+15
Incumbent
Lloyd Doggett
Incumbent
Democratic
Incumbent
1994
Results
Incumbent re-elected.
Candidates
▌Y Lloyd Doggett (Democratic) 71.3% ▌David Smalling (Republican) 26.0% ▌Clark Patterson (Libertarian) 2.7%
Texas 36
Texas 36
District
Texas 36
District
R+26
Incumbent
Brian Babin
Incumbent
Republican
Incumbent
2014
Results
Incumbent re-elected.
Candidates
▌Y Brian Babin (Republican) 72.6% ▌Dayna Steele (Democratic) 27.4%
District
Incumbent
Results
Candidates
Location
2017PVI
Representative
Party
Firstelected
Texas 1
R+25
Louie Gohmert
Republican
2004
Incumbent re-elected.
▌Y Louie Gohmert (Republican) 72.3% ▌Shirley McKellar (Democratic) 26.3% ▌Jeff Callaway (Libertarian) 1.4%
Texas 2
R+11
Ted Poe
Republican
2004
Incumbent retired.Republican hold.
▌Y Dan Crenshaw (Republican) 52.8% ▌Todd Litton (Democratic) 45.6% ▌Patrick Gunnels (Libertarian) 0.9% ▌Scott Cubbler (Independent) 0.7%
Texas 3
R+13
Sam Johnson
Republican
1991 (special)
Incumbent retired.Republican hold.
▌Y Van Taylor (Republican) 54.3% ▌Lorie Burch (Democratic) 44.3% ▌Christopher Claytor (Libertarian) 1.4%
Texas 4
R+28
John Ratcliffe
Republican
2014
Incumbent re-elected.
▌Y John Ratcliffe (Republican) 75.7% ▌Catherine Krantz (Democratic) 23.0% ▌Ken Ashby (Libertarian) 1.3%
Texas 5
R+16
Jeb Hensarling
Republican
2002
Incumbent retired.Republican hold.
▌Y Lance Gooden (Republican) 62.4% ▌Dan Wood (Democratic) 37.6%
Texas 6
R+9
Joe Barton
Republican
1984
Incumbent retired.Republican hold.
▌Y Ron Wright (Republican) 53.1% ▌Jana Lynne Sanchez (Democratic) 45.4% ▌Jason Allen Harber (Libertarian) 1.5%
Texas 7
R+7
John Culberson
Republican
2000
Incumbent lost re-election.Democratic gain.
▌Y Lizzie Fletcher (Democratic) 52.5% ▌John Culberson (Republican) 47.5%
Texas 8
R+28
Kevin Brady
Republican
1996
Incumbent re-elected.
▌Y Kevin Brady (Republican) 73.4% ▌Steven David (Democratic) 24.9% ▌Chris Duncan (Libertarian) 1.7%
Texas 9
D+29
Al Green
Democratic
2004
Incumbent re-elected.
▌Y Al Green (Democratic) 89.1% ▌Phil Kurtz (Libertarian) 3.9% ▌Benjamin Hernandez (Independent) 3.8% ▌Kesha Rogers (Independent) 3.3%
Texas 10
R+9
Michael McCaul
Republican
2004
Incumbent re-elected.
▌Y Michael McCaul (Republican) 51.1% ▌Mike Siegel (Democratic) 46.8% ▌Mike Ryan (Libertarian) 2.1%
Texas 11
R+32
Mike Conaway
Republican
2004
Incumbent re-elected.
▌Y Mike Conaway (Republican) 80.1% ▌Jennie Lou Leeder (Democratic) 18.4% ▌Rhett Rosenquest Smith (Libertarian) 1.5%
Texas 12
R+18
Kay Granger
Republican
1996
Incumbent re-elected.
▌Y Kay Granger (Republican) 64.3% ▌Vanessa Adia (Democratic) 33.9% ▌Jacob Leddy (Libertarian) 1.8%
Texas 13
R+33
Mac Thornberry
Republican
1994
Incumbent re-elected.
▌Y Mac Thornberry (Republican) 81.5% ▌Greg Sagan (Democratic) 16.9% ▌Calvin DeWeese (Libertarian) 1.6%
Texas 14
R+12
Randy Weber
Republican
2012
Incumbent re-elected.
▌Y Randy Weber (Republican) 59.2% ▌Adrienne Bell (Democratic) 39.3% ▌Don Conley (Libertarian) 1.4%
Texas 15
D+7
Vicente Gonzalez
Democratic
2016
Incumbent re-elected.
▌Y Vicente Gonzalez (Democratic) 59.7% ▌Tim Westley (Republican) 38.8% ▌Anthony Cristo (Libertarian) 1.5%
Texas 16
D+17
Beto O'Rourke
Democratic
2012
Incumbent retired to run for U.S. Senator.Democratic hold.
▌Y Veronica Escobar (Democratic) 68.5% ▌Rick Seeberger (Republican) 27.0% ▌Ben Mendoza (Independent) 1.6%
Texas 17
R+12
Bill Flores
Republican
2010
Incumbent re-elected.
▌Y Bill Flores (Republican) 56.8% ▌Rick Kennedy (Democratic) 41.3% ▌Peter Churchman (Libertarian) 1.9%
Texas 18
D+27
Sheila Jackson Lee
Democratic
1994
Incumbent re-elected.
▌Y Sheila Jackson Lee (Democratic) 75.2% ▌Ava Pate (Republican) 20.8% ▌Luke Spencer (Libertarian) 2.2%
Texas 19
R+27
Jodey Arrington
Republican
2016
Incumbent re-elected.
▌Y Jodey Arrington (Republican) 75.2% ▌Miguel Levario (Democratic) 24.8%
Texas 20
D+10
Joaquin Castro
Democratic
2012
Incumbent re-elected.
▌Y Joaquin Castro (Democratic) 80.9% ▌Jeffrey C. Blunt (Libertarian) 19.1%
Texas 21
R+10
Lamar Smith
Republican
1986
Incumbent retired.Republican hold.
▌Y Chip Roy (Republican) 50.2% ▌Joseph Kopser (Democratic) 47.6% ▌Lee Santos (Libertarian) 2.1%
Texas 22
R+10
Pete Olson
Republican
2008
Incumbent re-elected.
▌Y Pete Olson (Republican) 51.4% ▌Sri Preston Kulkarni (Democratic) 46.5% ▌John McElligott (Libertarian) 1.1% ▌Kellen Sweny (Independent) 1.1%
Texas 23
R+1
Will Hurd
Republican
2014
Incumbent re-elected.
▌Y Will Hurd (Republican) 49.2% ▌Gina Ortiz Jones (Democratic) 48.7% ▌Ruben Corvalan (Libertarian) 2.1%
Texas 24
R+9
Kenny Marchant
Republican
2004
Incumbent re-elected.
▌Y Kenny Marchant (Republican) 50.6% ▌Jan McDowell (Democratic) 47.5% ▌Mike Kolls (Libertarian) 1.8%
Texas 25
R+11
Roger Williams
Republican
2012
Incumbent re-elected.
▌Y Roger Williams (Republican) 53.5% ▌Julie Oliver (Democratic) 44.8% ▌Desarae Lindsey (Libertarian) 1.7%
Texas 26
R+18
Michael C. Burgess
Republican
2002
Incumbent re-elected.
▌Y Michael C. Burgess (Republican) 59.4% ▌Linsey Fagan (Democratic) 39.0% ▌Mark Boler (Libertarian) 1.6%
Texas 27
R+13
Michael Cloud
Republican
2018 (special)
Incumbent re-elected.
▌Y Michael Cloud (Republican) 60.3% ▌Eric Holguin (Democratic) 36.6% ▌James Duerr (Independent) 2.1% ▌Daniel Tinus (Libertarian) 1.0%
Texas 28
D+9
Henry Cuellar
Democratic
2004
Incumbent re-elected.
▌Y Henry Cuellar (Democratic) 84.4% ▌Arthur Thomas (Libertarian) 15.6%
Texas 29
D+19
Gene Green
Democratic
1992
Incumbent retired.Democratic hold.
▌Y Sylvia Garcia (Democratic) 75.1% ▌Phillip Aronoff (Republican) 23.9% ▌Cullen Burns (Libertarian) 1.0%
Texas 30
D+29
Eddie Bernice Johnson
Democratic
1992
Incumbent re-elected.
▌Y Eddie Bernice Johnson (Democratic) 91.1% ▌Shawn Jones (Libertarian) 8.9%
Texas 31
R+10
John Carter
Republican
2002
Incumbent re-elected.
▌Y John Carter (Republican) 50.6% ▌MJ Hegar (Democratic) 47.7% ▌Jason Hope (Libertarian) 1.7%
Texas 32
R+5
Pete Sessions
Republican
1996
Incumbent lost re-election.Democratic gain.
▌Y Colin Allred (Democratic) 52.3% ▌Pete Sessions (Republican) 45.8% ▌Melina Baker (Libertarian) 2.0%
Texas 33
D+23
Marc Veasey
Democratic
2012
Incumbent re-elected.
▌Y Marc Veasey (Democratic) 76.2% ▌Willie Billups (Republican) 21.9% ▌Jason Reeves (Libertarian) 1.9%
Texas 34
D+10
Filemon Vela Jr.
Democratic
2012
Incumbent re-elected.
▌Y Filemon Vela Jr. (Democratic) 60.0% ▌Rey Gonzalez (Republican) 40.0%
Texas 35
D+15
Lloyd Doggett
Democratic
1994
Incumbent re-elected.
▌Y Lloyd Doggett (Democratic) 71.3% ▌David Smalling (Republican) 26.0% ▌Clark Patterson (Libertarian) 2.7%
Texas 36
R+26
Brian Babin
Republican
2014
Incumbent re-elected.
▌Y Brian Babin (Republican) 72.6% ▌Dayna Steele (Democratic) 27.4%
· Utah
Location
Location
District
Location
District
2017PVI
Incumbent
Representative
Incumbent
Party
Incumbent
Firstelected
Utah 1
Utah 1
District
Utah 1
District
R+26
Incumbent
Rob Bishop
Incumbent
Republican
Incumbent
2002
Results
Incumbent re-elected.
Candidates
▌Y Rob Bishop (Republican) 61.6% ▌Lee Castillo (Democratic) 24.9% ▌Eric Eliason (United Utah) 11.6% ▌Adam Davis (Green) 1.9%
Utah 2
Utah 2
District
Utah 2
District
R+16
Incumbent
Chris Stewart
Incumbent
Republican
Incumbent
2012
Results
Incumbent re-elected.
Candidates
▌Y Chris Stewart (Republican) 56.1% ▌Shireen Ghorbani (Democratic) 38.9% ▌Jeffrey Whipple (Libertarian) 4.0%
Utah 3
Utah 3
District
Utah 3
District
R+25
Incumbent
John Curtis
Incumbent
Republican
Incumbent
2017 (special)
Results
Incumbent re-elected.
Candidates
▌Y John Curtis (Republican) 67.5% ▌James Singer (Democratic) 27.3% ▌Gregory Duerden (Independent American) 2.6% ▌Timothy Zeidner (United Utah) 2.6%
Utah 4
Utah 4
District
Utah 4
District
R+13
Incumbent
Mia Love
Incumbent
Republican
Incumbent
2014
Results
Incumbent lost re-election.Democratic gain.
Candidates
▌Y Ben McAdams (Democratic) 50.1% ▌Mia Love (Republican) 49.9%
District
Incumbent
Results
Candidates
Location
2017PVI
Representative
Party
Firstelected
Utah 1
R+26
Rob Bishop
Republican
2002
Incumbent re-elected.
▌Y Rob Bishop (Republican) 61.6% ▌Lee Castillo (Democratic) 24.9% ▌Eric Eliason (United Utah) 11.6% ▌Adam Davis (Green) 1.9%
Utah 2
R+16
Chris Stewart
Republican
2012
Incumbent re-elected.
▌Y Chris Stewart (Republican) 56.1% ▌Shireen Ghorbani (Democratic) 38.9% ▌Jeffrey Whipple (Libertarian) 4.0%
Utah 3
R+25
John Curtis
Republican
2017 (special)
Incumbent re-elected.
▌Y John Curtis (Republican) 67.5% ▌James Singer (Democratic) 27.3% ▌Gregory Duerden (Independent American) 2.6% ▌Timothy Zeidner (United Utah) 2.6%
Utah 4
R+13
Mia Love
Republican
2014
Incumbent lost re-election.Democratic gain.
▌Y Ben McAdams (Democratic) 50.1% ▌Mia Love (Republican) 49.9%
· Vermont
Location
Location
District
Location
District
2017PVI
Incumbent
Representative
Incumbent
Party
Incumbent
Firstelected
Vermont at-large
Vermont at-large
District
Vermont at-large
District
D+15
Incumbent
Peter Welch
Incumbent
Democratic
Incumbent
2006
Results
Incumbent re-elected.
Candidates
▌Y Peter Welch (Democratic) 69.2% ▌Anya Tynio (Republican) 26.0% ▌Cris Ericson (Independent) 3.3% ▌Laura Potter (Liberty Union) 1.4%
District
Incumbent
Results
Candidates
Location
2017PVI
Representative
Party
Firstelected
Vermont at-large
D+15
Peter Welch
Democratic
2006
Incumbent re-elected.
▌Y Peter Welch (Democratic) 69.2% ▌Anya Tynio (Republican) 26.0% ▌Cris Ericson (Independent) 3.3% ▌Laura Potter (Liberty Union) 1.4%
· Virginia
Location
Location
District
Location
District
2017PVI
Incumbent
Representative
Incumbent
Party
Incumbent
Firstelected
Virginia 1
Virginia 1
District
Virginia 1
District
R+8
Incumbent
Rob Wittman
Incumbent
Republican
Incumbent
2007 (special)
Results
Incumbent re-elected.
Candidates
▌Y Rob Wittman (Republican) 55.2% ▌Vangie Williams (Democratic) 44.8%
Virginia 2
Virginia 2
District
Virginia 2
District
R+3
Incumbent
Scott Taylor
Incumbent
Republican
Incumbent
2016
Results
Incumbent lost re-election.Democratic gain.
Candidates
▌Y Elaine Luria (Democratic) 51.1% ▌Scott Taylor (Republican) 48.9%
Virginia 3
Virginia 3
District
Virginia 3
District
D+16
Incumbent
Bobby Scott
Incumbent
Democratic
Incumbent
1992
Results
Incumbent re-elected.
Candidates
▌Y Bobby Scott (Democratic) 91.2%
Virginia 4
Virginia 4
District
Virginia 4
District
D+10
Incumbent
Donald McEachin
Incumbent
Democratic
Incumbent
2016
Results
Incumbent re-elected.
Candidates
▌Y Donald McEachin (Democratic) 62.6% ▌Ryan McAdams (Republican) 36.0% ▌Pete Wells (Libertarian) 1.4%
Virginia 5
Virginia 5
District
Virginia 5
District
R+6
Incumbent
Tom Garrett
Incumbent
Republican
Incumbent
2016
Results
Incumbent retired.Republican hold.
Candidates
▌Y Denver Riggleman (Republican) 53.3% ▌Leslie Cockburn (Democratic) 46.7%
Virginia 6
Virginia 6
District
Virginia 6
District
R+13
Incumbent
Bob Goodlatte
Incumbent
Republican
Incumbent
1992
Results
Incumbent retired.Republican hold.
Candidates
▌Y Ben Cline (Republican) 59.8% ▌Jennifer Lewis (Democratic) 40.2%
Virginia 7
Virginia 7
District
Virginia 7
District
R+6
Incumbent
Dave Brat
Incumbent
Republican
Incumbent
2014
Results
Incumbent lost re-election.Democratic gain.
Candidates
▌Y Abigail Spanberger (Democratic) 50.4% ▌Dave Brat (Republican) 48.4% ▌Joe Walton (Libertarian) 1.2%
Virginia 8
Virginia 8
District
Virginia 8
District
D+21
Incumbent
Don Beyer
Incumbent
Democratic
Incumbent
2014
Results
Incumbent re-elected.
Candidates
▌Y Don Beyer (Democratic) 76.3% ▌Thomas Oh (Republican) 23.7%
Virginia 9
Virginia 9
District
Virginia 9
District
R+19
Incumbent
Morgan Griffith
Incumbent
Republican
Incumbent
2010
Results
Incumbent re-elected.
Candidates
▌Y Morgan Griffith (Republican) 65.2% ▌Anthony Flaccavento (Democratic) 34.8%
Virginia 10
Virginia 10
District
Virginia 10
District
D+1
Incumbent
Barbara Comstock
Incumbent
Republican
Incumbent
2014
Results
Incumbent lost re-election.New member elected.Democratic gain.
Candidates
▌Y Jennifer Wexton (Democratic) 56.2% ▌Barbara Comstock (Republican) 43.8%
Virginia 11
Virginia 11
District
Virginia 11
District
D+15
Incumbent
Gerry Connolly
Incumbent
Democratic
Incumbent
2008
Results
Incumbent re-elected.
Candidates
▌Y Gerry Connolly (Democratic) 71.2% ▌Jeff Dove (Republican) 27.0% ▌Stevan Porter (Libertarian) 1.8%
District
Incumbent
Results
Candidates
Location
2017PVI
Representative
Party
Firstelected
Virginia 1
R+8
Rob Wittman
Republican
2007 (special)
Incumbent re-elected.
▌Y Rob Wittman (Republican) 55.2% ▌Vangie Williams (Democratic) 44.8%
Virginia 2
R+3
Scott Taylor
Republican
2016
Incumbent lost re-election.Democratic gain.
▌Y Elaine Luria (Democratic) 51.1% ▌Scott Taylor (Republican) 48.9%
Virginia 3
D+16
Bobby Scott
Democratic
1992
Incumbent re-elected.
▌Y Bobby Scott (Democratic) 91.2%
Virginia 4
D+10
Donald McEachin
Democratic
2016
Incumbent re-elected.
▌Y Donald McEachin (Democratic) 62.6% ▌Ryan McAdams (Republican) 36.0% ▌Pete Wells (Libertarian) 1.4%
Virginia 5
R+6
Tom Garrett
Republican
2016
Incumbent retired.Republican hold.
▌Y Denver Riggleman (Republican) 53.3% ▌Leslie Cockburn (Democratic) 46.7%
Virginia 6
R+13
Bob Goodlatte
Republican
1992
Incumbent retired.Republican hold.
▌Y Ben Cline (Republican) 59.8% ▌Jennifer Lewis (Democratic) 40.2%
Virginia 7
R+6
Dave Brat
Republican
2014
Incumbent lost re-election.Democratic gain.
▌Y Abigail Spanberger (Democratic) 50.4% ▌Dave Brat (Republican) 48.4% ▌Joe Walton (Libertarian) 1.2%
Virginia 8
D+21
Don Beyer
Democratic
2014
Incumbent re-elected.
▌Y Don Beyer (Democratic) 76.3% ▌Thomas Oh (Republican) 23.7%
Virginia 9
R+19
Morgan Griffith
Republican
2010
Incumbent re-elected.
▌Y Morgan Griffith (Republican) 65.2% ▌Anthony Flaccavento (Democratic) 34.8%
Virginia 10
D+1
Barbara Comstock
Republican
2014
Incumbent lost re-election.New member elected.Democratic gain.
▌Y Jennifer Wexton (Democratic) 56.2% ▌Barbara Comstock (Republican) 43.8%
Virginia 11
D+15
Gerry Connolly
Democratic
2008
Incumbent re-elected.
▌Y Gerry Connolly (Democratic) 71.2% ▌Jeff Dove (Republican) 27.0% ▌Stevan Porter (Libertarian) 1.8%
· Washington
Location
Location
District
Location
District
2017PVI
Incumbent
Representative
Incumbent
Party
Incumbent
Firstelected
Washington 1
Washington 1
District
Washington 1
District
D+6
Incumbent
Suzan DelBene
Incumbent
Democratic
Incumbent
2012
Results
Incumbent re-elected.
Candidates
▌Y Suzan DelBene (Democratic) 59.3% ▌Jeffrey Beeler (Republican) 40.7%
Washington 2
Washington 2
District
Washington 2
District
D+10
Incumbent
Rick Larsen
Incumbent
Democratic
Incumbent
2000
Results
Incumbent re-elected.
Candidates
▌Y Rick Larsen (Democratic) 71.3% ▌Brian Luke (Libertarian) 28.7%
Washington 3
Washington 3
District
Washington 3
District
R+4
Incumbent
Jaime Herrera Beutler
Incumbent
Republican
Incumbent
2010
Results
Incumbent re-elected.
Candidates
▌Y Jaime Herrera Beutler (Republican) 52.7% ▌Carolyn Long (Democratic) 47.3%
Washington 4
Washington 4
District
Washington 4
District
R+13
Incumbent
Dan Newhouse
Incumbent
Republican
Incumbent
2014
Results
Incumbent re-elected.
Candidates
▌Y Dan Newhouse (Republican) 62.8% ▌Christine Brown (Democratic) 37.2%
Washington 5
Washington 5
District
Washington 5
District
R+8
Incumbent
Cathy McMorris Rodgers
Incumbent
Republican
Incumbent
2004
Results
Incumbent re-elected.
Candidates
▌Y Cathy McMorris Rodgers (Republican) 54.8% ▌Lisa Brown (Democratic) 45.2%
Washington 6
Washington 6
District
Washington 6
District
D+6
Incumbent
Derek Kilmer
Incumbent
Democratic
Incumbent
2012
Results
Incumbent re-elected.
Candidates
▌Y Derek Kilmer (Democratic) 63.9% ▌Douglas Dightman (Republican) 36.1%
Washington 7
Washington 7
District
Washington 7
District
D+33
Incumbent
Pramila Jayapal
Incumbent
Democratic
Incumbent
2016
Results
Incumbent re-elected.
Candidates
▌Y Pramila Jayapal (Democratic) 83.6% ▌Craig Keller (Republican) 16.4%
Washington 8
Washington 8
District
Washington 8
District
EVEN
Incumbent
Dave Reichert
Incumbent
Republican
Incumbent
2004
Results
Incumbent retired.Democratic gain.
Candidates
▌Y Kim Schrier (Democratic) 52.4% ▌Dino Rossi (Republican) 47.6%
Washington 9
Washington 9
District
Washington 9
District
D+21
Incumbent
Adam Smith
Incumbent
Democratic
Incumbent
1996
Results
Incumbent re-elected.
Candidates
▌Y Adam Smith (Democratic) 67.9% ▌Sarah Smith (Democratic) 32.1%
Washington 10
Washington 10
District
Washington 10
District
D+5
Incumbent
Denny Heck
Incumbent
Democratic
Incumbent
2012
Results
Incumbent re-elected.
Candidates
▌Y Denny Heck (Democratic) 61.5% ▌Joseph Brumbles (Republican) 38.5%
District
Incumbent
Results
Candidates
Location
2017PVI
Representative
Party
Firstelected
Washington 1
D+6
Suzan DelBene
Democratic
2012
Incumbent re-elected.
▌Y Suzan DelBene (Democratic) 59.3% ▌Jeffrey Beeler (Republican) 40.7%
Washington 2
D+10
Rick Larsen
Democratic
2000
Incumbent re-elected.
▌Y Rick Larsen (Democratic) 71.3% ▌Brian Luke (Libertarian) 28.7%
Washington 3
R+4
Jaime Herrera Beutler
Republican
2010
Incumbent re-elected.
▌Y Jaime Herrera Beutler (Republican) 52.7% ▌Carolyn Long (Democratic) 47.3%
Washington 4
R+13
Dan Newhouse
Republican
2014
Incumbent re-elected.
▌Y Dan Newhouse (Republican) 62.8% ▌Christine Brown (Democratic) 37.2%
Washington 5
R+8
Cathy McMorris Rodgers
Republican
2004
Incumbent re-elected.
▌Y Cathy McMorris Rodgers (Republican) 54.8% ▌Lisa Brown (Democratic) 45.2%
Washington 6
D+6
Derek Kilmer
Democratic
2012
Incumbent re-elected.
▌Y Derek Kilmer (Democratic) 63.9% ▌Douglas Dightman (Republican) 36.1%
Washington 7
D+33
Pramila Jayapal
Democratic
2016
Incumbent re-elected.
▌Y Pramila Jayapal (Democratic) 83.6% ▌Craig Keller (Republican) 16.4%
Washington 8
EVEN
Dave Reichert
Republican
2004
Incumbent retired.Democratic gain.
▌Y Kim Schrier (Democratic) 52.4% ▌Dino Rossi (Republican) 47.6%
Washington 9
D+21
Adam Smith
Democratic
1996
Incumbent re-elected.
▌Y Adam Smith (Democratic) 67.9% ▌Sarah Smith (Democratic) 32.1%
Washington 10
D+5
Denny Heck
Democratic
2012
Incumbent re-elected.
▌Y Denny Heck (Democratic) 61.5% ▌Joseph Brumbles (Republican) 38.5%
· West Virginia
Location
Location
District
Location
District
2017PVI
Incumbent
Representative
Incumbent
Party
Incumbent
Firstelected
West Virginia 1
West Virginia 1
District
West Virginia 1
District
R+19
Incumbent
David McKinley
Incumbent
Republican
Incumbent
2010
Results
Incumbent re-elected.
Candidates
▌Y David McKinley (Republican) 64.6% ▌Kendra Fershee (Democratic) 35.4%
West Virginia 2
West Virginia 2
District
West Virginia 2
District
R+17
Incumbent
Alex Mooney
Incumbent
Republican
Incumbent
2014
Results
Incumbent re-elected.
Candidates
▌Y Alex Mooney (Republican) 54.0% ▌Talley Sergent (Democratic) 43.0% ▌Daniel Lutz (Mountain) 3.1%
West Virginia 3
West Virginia 3
District
West Virginia 3
District
R+23
Incumbent
Vacant
Incumbent
Evan Jenkins (R) resigned September 30, 2018 to join the West Virginia Supreme Court of Appeals.Republican hold.
Incumbent
▌Y Carol Miller (Republican) 56.4% ▌Richard Ojeda (Democratic) 43.6%
District
Incumbent
Results
Candidates
Location
2017PVI
Representative
Party
Firstelected
West Virginia 1
R+19
David McKinley
Republican
2010
Incumbent re-elected.
▌Y David McKinley (Republican) 64.6% ▌Kendra Fershee (Democratic) 35.4%
West Virginia 2
R+17
Alex Mooney
Republican
2014
Incumbent re-elected.
▌Y Alex Mooney (Republican) 54.0% ▌Talley Sergent (Democratic) 43.0% ▌Daniel Lutz (Mountain) 3.1%
West Virginia 3
R+23
Vacant
Evan Jenkins (R) resigned September 30, 2018 to join the West Virginia Supreme Court of Appeals.Republican hold.
▌Y Carol Miller (Republican) 56.4% ▌Richard Ojeda (Democratic) 43.6%
· Wisconsin
Location
Location
District
Location
District
2017PVI
Incumbent
Representative
Incumbent
Party
Incumbent
Firstelected
Wisconsin 1
Wisconsin 1
District
Wisconsin 1
District
R+5
Incumbent
Paul Ryan
Incumbent
Republican
Incumbent
1998
Results
Incumbent retired.Republican hold.
Candidates
▌Y Bryan Steil (Republican) 54.6% ▌Randy Bryce (Democratic) 42.3% ▌Ken Yorgan (Independent) 3.1%
Wisconsin 2
Wisconsin 2
District
Wisconsin 2
District
D+18
Incumbent
Mark Pocan
Incumbent
Democratic
Incumbent
2012
Results
Incumbent re-elected.
Candidates
▌Y Mark Pocan (Democratic) 97.4%
Wisconsin 3
Wisconsin 3
District
Wisconsin 3
District
EVEN
Incumbent
Ron Kind
Incumbent
Democratic
Incumbent
1996
Results
Incumbent re-elected.
Candidates
▌Y Ron Kind (Democratic) 59.7% ▌Steve Toft (Republican) 40.3%
Wisconsin 4
Wisconsin 4
District
Wisconsin 4
District
D+25
Incumbent
Gwen Moore
Incumbent
Democratic
Incumbent
2004
Results
Incumbent re-elected.
Candidates
▌Y Gwen Moore (Democratic) 75.7% ▌Tim Rogers (Republican) 21.7% ▌Robert Raymond (Independent) 2.6%
Wisconsin 5
Wisconsin 5
District
Wisconsin 5
District
R+13
Incumbent
Jim Sensenbrenner
Incumbent
Republican
Incumbent
1978
Results
Incumbent re-elected.
Candidates
▌Y Jim Sensenbrenner (Republican) 62.0% ▌Tom Palzewicz (Democratic) 38.0%
Wisconsin 6
Wisconsin 6
District
Wisconsin 6
District
R+8
Incumbent
Glenn Grothman
Incumbent
Republican
Incumbent
2014
Results
Incumbent re-elected.
Candidates
▌Y Glenn Grothman (Republican) 55.5% ▌Dan Kohl (Democratic) 44.5%
Wisconsin 7
Wisconsin 7
District
Wisconsin 7
District
R+8
Incumbent
Sean Duffy
Incumbent
Republican
Incumbent
2010
Results
Incumbent re-elected.
Candidates
▌Y Sean Duffy (Republican) 59.9% ▌Margaret Engebretson (Democratic) 38.4% ▌Ken Driessen (Independent) 1.7%
Wisconsin 8
Wisconsin 8
District
Wisconsin 8
District
R+7
Incumbent
Mike Gallagher
Incumbent
Republican
Incumbent
2016
Results
Incumbent re-elected.
Candidates
▌Y Mike Gallagher (Republican) 63.7% ▌Beau Liegeois (Democratic) 36.3%
District
Incumbent
Results
Candidates
Location
2017PVI
Representative
Party
Firstelected
Wisconsin 1
R+5
Paul Ryan
Republican
1998
Incumbent retired.Republican hold.
▌Y Bryan Steil (Republican) 54.6% ▌Randy Bryce (Democratic) 42.3% ▌Ken Yorgan (Independent) 3.1%
Wisconsin 2
D+18
Mark Pocan
Democratic
2012
Incumbent re-elected.
▌Y Mark Pocan (Democratic) 97.4%
Wisconsin 3
EVEN
Ron Kind
Democratic
1996
Incumbent re-elected.
▌Y Ron Kind (Democratic) 59.7% ▌Steve Toft (Republican) 40.3%
Wisconsin 4
D+25
Gwen Moore
Democratic
2004
Incumbent re-elected.
▌Y Gwen Moore (Democratic) 75.7% ▌Tim Rogers (Republican) 21.7% ▌Robert Raymond (Independent) 2.6%
Wisconsin 5
R+13
Jim Sensenbrenner
Republican
1978
Incumbent re-elected.
▌Y Jim Sensenbrenner (Republican) 62.0% ▌Tom Palzewicz (Democratic) 38.0%
Wisconsin 6
R+8
Glenn Grothman
Republican
2014
Incumbent re-elected.
▌Y Glenn Grothman (Republican) 55.5% ▌Dan Kohl (Democratic) 44.5%
Wisconsin 7
R+8
Sean Duffy
Republican
2010
Incumbent re-elected.
▌Y Sean Duffy (Republican) 59.9% ▌Margaret Engebretson (Democratic) 38.4% ▌Ken Driessen (Independent) 1.7%
Wisconsin 8
R+7
Mike Gallagher
Republican
2016
Incumbent re-elected.
▌Y Mike Gallagher (Republican) 63.7% ▌Beau Liegeois (Democratic) 36.3%
· Wyoming
Location
Location
District
Location
District
2017PVI
Incumbent
Representative
Incumbent
Party
Incumbent
First Elected
Wyoming at-large
Wyoming at-large
District
Wyoming at-large
District
R+25
Incumbent
Liz Cheney
Incumbent
Republican
Incumbent
2016
Results
Incumbent re-elected.
Candidates
▌Y Liz Cheney (Republican) 63.7% ▌Greg Hunter (Democratic) 29.8% ▌Richard Brubaker (Libertarian) 3.5% ▌Daniel Cummings (Constitution) 3.0%
District
Incumbent
Results
Candidates
Location
2017PVI
Representative
Party
First Elected
Wyoming at-large
R+25
Liz Cheney
Republican
2016
Incumbent re-elected.
▌Y Liz Cheney (Republican) 63.7% ▌Greg Hunter (Democratic) 29.8% ▌Richard Brubaker (Libertarian) 3.5% ▌Daniel Cummings (Constitution) 3.0%
· Non-voting delegates › American Samoa
Delegate
Delegate
District
Delegate
Incumbent
Party
Incumbent
Firstelected
American Samoa at-large
District
American Samoa at-large
Incumbent
Amata Coleman Radewagen
Incumbent
Republican
Incumbent
2014
Results
Incumbent re-elected.
Candidates
▌Y Amata Coleman Radewagen (Republican) 83.28% ▌Tuika Tuika (Independent) 9.09% ▌Meleagi Suitonu Chapman (Democratic) 7.63%
District
Incumbent
Results
Candidates
Delegate
Party
Firstelected
American Samoa at-large
Amata Coleman Radewagen
Republican
2014
Incumbent re-elected.
▌Y Amata Coleman Radewagen (Republican) 83.28% ▌Tuika Tuika (Independent) 9.09% ▌Meleagi Suitonu Chapman (Democratic) 7.63%
· Non-voting delegates › District of Columbia
Delegate
Delegate
District
Delegate
Incumbent
Party
Incumbent
Firstelected
District of Columbia at-large
District
District of Columbia at-large
Incumbent
Eleanor Holmes Norton
Incumbent
Democratic
Incumbent
1990
Results
Incumbent re-elected.
Candidates
▌Y Eleanor Holmes Norton (Democratic) 87.7% ▌Nelson Rimensnyder (Republican) 4.3% ▌Natale Stracuzzi (D.C. Statehood Green) 3.8% ▌Erik Metzroh (Independent) 2.4% ▌Bruce Majors (Libertarian) 1.8%
District
Incumbent
Results
Candidates
Delegate
Party
Firstelected
District of Columbia at-large
Eleanor Holmes Norton
Democratic
1990
Incumbent re-elected.
▌Y Eleanor Holmes Norton (Democratic) 87.7% ▌Nelson Rimensnyder (Republican) 4.3% ▌Natale Stracuzzi (D.C. Statehood Green) 3.8% ▌Erik Metzroh (Independent) 2.4% ▌Bruce Majors (Libertarian) 1.8%
· Non-voting delegates › Guam
Delegate
Delegate
District
Delegate
Incumbent
Party
Incumbent
Firstelected
Guam at-large
Guam at-large
District
Guam at-large
Incumbent
Madeleine Bordallo
Incumbent
Democratic
Incumbent
2002
Results
Incumbent lost renomination.Democratic hold.
Candidates
▌Y Michael San Nicolas (Democratic) 54.9% ▌Doris Flores Brooks (Republican) 44.0% Write-ins 1.14%
District
Incumbent
Results
Candidates
Delegate
Party
Firstelected
Guam at-large
Madeleine Bordallo
Democratic
2002
Incumbent lost renomination.Democratic hold.
▌Y Michael San Nicolas (Democratic) 54.9% ▌Doris Flores Brooks (Republican) 44.0% Write-ins 1.14%
· Non-voting delegates › Northern Mariana Islands
Delegate
Delegate
District
Delegate
Incumbent
Party
Incumbent
Firstelected
Northern Mariana Islands at-large
District
Northern Mariana Islands at-large
Incumbent
Gregorio Sablan
Incumbent
Independent
Incumbent
2008
Results
Incumbent re-elected.
Candidates
▌Y Gregorio Sablan (Independent) 63.77% ▌Angel Demapan (Republican) 36.23%
District
Incumbent
Results
Candidates
Delegate
Party
Firstelected
Northern Mariana Islands at-large
Gregorio Sablan
Independent
2008
Incumbent re-elected.
▌Y Gregorio Sablan (Independent) 63.77% ▌Angel Demapan (Republican) 36.23%
· Non-voting delegates › United States Virgin Islands
Delegate
Delegate
District
Delegate
Incumbent
Party
Incumbent
Firstelected
United States Virgin Islands at-large
District
United States Virgin Islands at-large
Incumbent
Stacey Plaskett
Incumbent
Democratic
Incumbent
2014
Results
Incumbent re-elected.
Candidates
▌Y Stacey Plaskett (Democratic) 98.41% Write-ins 1.59%
District
Incumbent
Results
Candidates
Delegate
Party
Firstelected
United States Virgin Islands at-large
Stacey Plaskett
Democratic
2014
Incumbent re-elected.
▌Y Stacey Plaskett (Democratic) 98.41% Write-ins 1.59%

References

  1. In addition, five of the six non-voting delegates in the U.S. House of Representatives were elected.
  2. Results from North Carolina's 9th congressional district were voided, leading to a September 2019 special election that
  3. This figure represents the difference between the number of Democrats seated when the 116th Congress convened in January
  4. This figure represents the difference between the number of Republicans seated when the 116th Congress convened in Janua
  5. The 116th Congress has one vacancy in the House of Representatives. For further information, see 2018 North Carolina's 9
  6. Non-voting delegates from the District of Columbia and from four of the five inhabited U.S. territories--not including t
  7. This seat was the tipping point seat for a Democratic majority.
  8. All races were decided on the initial primary date, eliminating the need for a runoff.
  9. Louisiana will hold runoff election(s) on December 8, 2018, for any race in which no one candidate wins a majority of th
  10. Galvin won the Democratic nomination as an "Undeclared" candidate. She would be listed on the ballot as "Undeclared" and
  11. On September 24, 2018, the Democratic nominee in Florida's 17th congressional district, April Freeman, died. On October
  12. The Libertarian Party does not have ballot access in Ohio or Tennessee. Therefore, Libertarian candidates Johnathan Mill
  13. electproject.org
    http://www.electproject.org/2018g
  14. Federal Elections 2016: Election Results for the U.S. President, the U.S. Senate and the U.S. House of Representatives
    https://transition.fec.gov/pubrec/fe2016/federalelections2016.pdf
  15. "Statistics of the Congressional Election of November 6, 2018"
    http://history.house.gov/Institution/Election-Statistics/Election-Statistics/
  16. Los Angeles Times
    https://www.latimes.com/politics/la-me-pol-valadao-cox-victory-20181128-story.html
  17. "2018 House Popular Vote Tracker"
    https://web.archive.org/web/20190103034238/https://docs.google.com/spreadsheets/d/1WxDaxD5az6kdOjJncmGph37z0BPNhV1fNAH_g7IkpC0/edit#gid=0
  18. CNN
    https://www.cnn.com/2018/12/06/politics/latest-house-vote-blue-wave/index.html
  19. NBC News
    https://www.nbcnews.com/politics/congress/what-happens-now-democrats-will-retake-house-n930556
  20. apnews.com
    https://www.apnews.com/9fd72a4c1c5742aead977ee27815d776
  21. electproject.org
    http://www.electproject.org/national-1789-present
  22. Niskanen Center
    https://www.niskanencenter.org/how-republicans-lost-2018-by-being-too-close-to-trump/
  23. Vox
    https://www.vox.com/policy-and-politics/2018/11/7/18070152/midterm-elections-2018-results-trump-obamacare-repeal
  24. Office of the Clerk of the U.S. House of Representatives
    http://clerk.house.gov/member_info/cong.aspx
  25. history.house.gov
    https://history.house.gov/Institution/Election-Statistics/
  26. The Atlantic
    https://web.archive.org/web/20180203012750/https://www.theatlantic.com/politics/archive/2018/01/the-2018-congressional-retirement-tracker/545723
  27. AOL
    https://www.aol.com/article/news/2018/04/02/connecticut-rep-elizabeth-esty-not-seeking-re-election-to-us-house/23401226
  28. Star Tribune
    http://www.startribune.com/candidates-make-it-official-on-final-filing-day/484590681
  29. Duluth News Tribune
    http://www.duluthnewstribune.com/news/government-and-politics/4401206-rick-nolan-announces-he-wont-seek-re-election
  30. The Hill
    https://thehill.com/homenews/campaign/390639-retiring-democratic-rep-to-run-for-lieutenant-governor-in-minnesota/
  31. The Washington Post
    https://www.washingtonpost.com/news/powerpost/wp/2017/12/16/rep-ruben-kihuen-wont-seek-reelection-amid-sexual-harassment-allegations
  32. Tampa Bay Times
    https://www.tampabay.com/florida-politics/buzz/2018/04/11/rep-dennis-ross-is-retiring/
  33. Tampa Bay Times
    https://www.tampabay.com/florida-politics/buzz/2018/02/19/rep-tom-rooney-will-not-seek-re-election/
  34. The Washington Times
    https://www.washingtontimes.com/news/2018/feb/19/report-tom-rooney-will-not-seek-re-election
  35. The Washington Examiner
    http://www.washingtonexaminer.com/gop-rep-frank-lobiondo-will-not-seek-re-election/article/2639895
  36. "Republican Kevin Cramer announces bid to challenge Heitkamp for Senate in North Dakota"
    https://www.foxnews.com/politics/republican-kevin-cramer-announces-bid-to-challenge-heitkamp-for-senate-in-north-dakota
  37. "Rep. Ryan Costello will drop bid for reelection in Pennsylvania"
    https://www.cnn.com/2018/03/24/politics/ryan-costello-pennsylvania/index.html
  38. "Gowdy, key player in Clinton, Trump campaign probes, won't seek another term"
    http://www.mcclatchydc.com/news/politics-government/article197602894.html
  39. The Tennessean
    http://www.tennessean.com/story/news/2017/10/05/u-s-rep-marsha-blackburn-launches-senate-bid-bob-corker-seat/708717001
  40. The Washington Post
    https://www.washingtonpost.com/local/virginia-politics/rep-garrett-announces-he-is-an-alcoholic-and-will-not-seek-re-election/2018/05/28/40e8839a-62b2-11e8-99d2-0d678ec08c2f_story.html
  41. Pacific Island Times
    https://www.pacificislandtimes.com/single-post/2018/08/26/LouJosh-ahead-by-slim-margin-San-Nicolas-beats-Bordallo
  42. Roll Call
    https://www.rollcall.com/news/politics/guam-delegate-to-leave-congress-after-primary-loss
  43. "6 Takeaways From the 2018 Primary Season, So Far"
    https://www.rollcall.com/news/politics/five-takeaways-from-the-primaries
  44. Politico
    https://politi.co/2JNP1Xa
  45. LocalSYR
    https://web.archive.org/web/20181130054149/https://www.localsyr.com/election/your-local-election/counting-ny-22-it-s-mathematically-impossible-for-rep-tenney-to-overcome-brindisi-s-lead/1610126249
  46. AP News
    https://apnews.com/a41a959d29c44658aa7ac3c1e762f1a1
  47. Politico
    https://politi.co/2JKvyXj
  48. HuffPost
    https://www.huffpost.com/entry/jeff-van-drew-switches-parties-trump_n_5dfbd87ae4b0eb2264d6a68a
  49. NBC News
    https://www.nbcnews.com/politics/congress/rep-ron-desantis-resigns-congress-n908146
  50. The Florida Times-Union
    https://www.jacksonville.com/story/news/politics/elections/local/2018/09/10/florida-gop-nominee-for-governor-ron-desantis-resigns-from-congress/10799671007/
  51. SpaceNews
    https://spacenews.com/bridenstine-sworn-in-as-nasa-administrator/
  52. www.news9.com
    https://www.news9.com/story/5e35d3d42f69d76f62018200/first-district-congressman-kevin-hern-sworn-into-office
  53. www.news9.com
    https://www.news9.com/story/5e35d4332f69d76f620184ca/first-district-congressmanelect-kevin-hern-to-be-sworn-in-early
  54. The New York Times
    https://www.nytimes.com/interactive/2018/us/elections/calendar-primary-results.html,%2520https://www.nytimes.com/interactive/2018/us/elections/calendar-primary-results.html
  55. Philadelphia Inquirer
    http://www.philly.com/philly/news/politics/pat-meehan-pa-resigns-will-pay-back-sexual-harassment-settlement-20180427.html
  56. The Morning Call
    https://web.archive.org/web/20181116021937/https://www.mcall.com/opinion/yourview/mc-rep-charlie-dent-resigns-farewell-address-0513-20180512-story.html
  57. "Exit Polls 2018"
    https://www.cnn.com/election/2018/exit-polls
  58. Daily Kos Elections
    https://www.dailykos.com/stories/2017/12/4/1721045/-Daily-Kos-Elections-2018-primary-calendar
  59. The Green Papers
    http://www.thegreenpapers.com/G18/events.phtml?format=chronological&type=ef
  60. The Green Papers
    https://www.thegreenpapers.com/G18/closing.phtml?format=gc
  61. The New York Times
    https://www.nytimes.com/interactive/2018/11/06/us/elections/results-alabama-elections.html,%2520https://www.nytimes.com/interactive/2018/11/06/us/elections/results-alabama-elections.html
  62. The New York Times
    https://www.nytimes.com/elections/results/alaska-house-district-at-large
  63. The New York Times
    https://www.nytimes.com/interactive/2018/11/06/us/elections/results-arizona-elections.html,%2520https://www.nytimes.com/interactive/2018/11/06/us/elections/results-arizona-elections.html
  64. The New York Times
    https://www.nytimes.com/interactive/2018/11/06/us/elections/results-california-elections.html,%2520https://www.nytimes.com/interactive/2018/11/06/us/elections/results-california-elections.html
  65. The New York Times
    https://www.nytimes.com/interactive/2018/11/06/us/elections/results-colorado-elections.html,%2520https://www.nytimes.com/interactive/2018/11/06/us/elections/results-colorado-elections.html
  66. The New York Times
    https://www.nytimes.com/interactive/2018/11/06/us/elections/results-connecticut-elections.html,%2520https://www.nytimes.com/interactive/2018/11/06/us/elections/results-connecticut-elections.html
  67. The New York Times
    https://www.nytimes.com/interactive/2018/11/06/us/elections/results-delaware-elections.html,%2520https://www.nytimes.com/interactive/2018/11/06/us/elections/results-delaware-elections.html
  68. The New York Times
    https://www.nytimes.com/interactive/2018/11/06/us/elections/results-florida-elections.html,%2520https://www.nytimes.com/interactive/2018/11/06/us/elections/results-florida-elections.html
  69. The New York Times
    https://www.nytimes.com/interactive/2018/11/06/us/elections/results-georgia-elections.html,%2520https://www.nytimes.com/interactive/2018/11/06/us/elections/results-georgia-elections.html
  70. The New York Times
    https://www.nytimes.com/interactive/2018/11/06/us/elections/results-hawaii-elections.html,%2520https://www.nytimes.com/interactive/2018/11/06/us/elections/results-hawaii-elections.html
  71. The New York Times
    https://www.nytimes.com/interactive/2018/11/06/us/elections/results-idaho-elections.html,%2520https://www.nytimes.com/interactive/2018/11/06/us/elections/results-idaho-elections.html
  72. The New York Times
    https://www.nytimes.com/interactive/2018/11/06/us/elections/results-illinois-elections.html,%2520https://www.nytimes.com/interactive/2018/11/06/us/elections/results-illinois-elections.html
  73. The New York Times
    https://www.nytimes.com/interactive/2018/11/06/us/elections/results-indiana-elections.html,%2520https://www.nytimes.com/interactive/2018/11/06/us/elections/results-indiana-elections.html
  74. The New York Times
    https://www.nytimes.com/interactive/2018/11/06/us/elections/results-iowa-elections.html,%2520https://www.nytimes.com/interactive/2018/11/06/us/elections/results-iowa-elections.html
  75. The New York Times
    https://www.nytimes.com/interactive/2018/11/06/us/elections/results-kansas-elections.html,%2520https://www.nytimes.com/interactive/2018/11/06/us/elections/results-kansas-elections.html
  76. The New York Times
    https://www.nytimes.com/interactive/2018/11/06/us/elections/results-kentucky-elections.html,%2520https://www.nytimes.com/interactive/2018/11/06/us/elections/results-kentucky-elections.html
  77. The New York Times
    https://www.nytimes.com/interactive/2018/11/06/us/elections/results-louisiana-elections.html,%2520https://www.nytimes.com/interactive/2018/11/06/us/elections/results-louisiana-elections.html
  78. The New York Times
    https://www.nytimes.com/interactive/2018/11/06/us/elections/results-maine-elections.html,%2520https://www.nytimes.com/interactive/2018/11/06/us/elections/results-maine-elections.html
  79. The New York Times
    https://www.nytimes.com/interactive/2018/11/06/us/elections/results-maryland-elections.html,%2520https://www.nytimes.com/interactive/2018/11/06/us/elections/results-maryland-elections.html
  80. The New York Times
    https://www.nytimes.com/interactive/2018/11/06/us/elections/results-massachusetts-elections.html,%2520https://www.nytimes.com/interactive/2018/11/06/us/elections/results-massachusetts-elections.html
  81. The New York Times
    https://www.nytimes.com/interactive/2018/11/06/us/elections/results-michigan-elections.html,%2520https://www.nytimes.com/interactive/2018/11/06/us/elections/results-michigan-elections.html
  82. The New York Times
    https://www.nytimes.com/interactive/2018/11/06/us/elections/results-minnesota-elections.html,%2520https://www.nytimes.com/interactive/2018/11/06/us/elections/results-minnesota-elections.html
  83. The New York Times
    https://www.nytimes.com/interactive/2018/11/06/us/elections/results-mississippi-elections.html,%2520https://www.nytimes.com/interactive/2018/11/06/us/elections/results-mississippi-elections.html
  84. The New York Times
    https://www.nytimes.com/interactive/2018/11/06/us/elections/results-missouri-elections.html,%2520https://www.nytimes.com/interactive/2018/11/06/us/elections/results-missouri-elections.html
  85. The New York Times
    https://www.nytimes.com/interactive/2018/11/06/us/elections/results-montana-elections.html,%2520https://www.nytimes.com/interactive/2018/11/06/us/elections/results-montana-elections.html
  86. The New York Times
    https://www.nytimes.com/interactive/2018/11/06/us/elections/results-nebraska-elections.html,%2520https://www.nytimes.com/interactive/2018/11/06/us/elections/results-nebraska-elections.html
  87. The New York Times
    https://www.nytimes.com/interactive/2018/11/06/us/elections/results-nevada-elections.html,%2520https://www.nytimes.com/interactive/2018/11/06/us/elections/results-nevada-elections.html
  88. The New York Times
    https://www.nytimes.com/interactive/2018/11/06/us/elections/results-new-hampshire-elections.html,%2520https://www.nytimes.com/interactive/2018/11/06/us/elections/results-new-hampshire-elections.html
  89. The New York Times
    https://www.nytimes.com/interactive/2018/11/06/us/elections/results-new-jersey-elections.html,%2520https://www.nytimes.com/interactive/2018/11/06/us/elections/results-new-jersey-elections.html
  90. The New York Times
    https://www.nytimes.com/interactive/2018/11/06/us/elections/results-new-mexico-elections.html,%2520https://www.nytimes.com/interactive/2018/11/06/us/elections/results-new-mexico-elections.html
  91. The New York Times
    https://www.nytimes.com/interactive/2018/11/06/us/elections/results-new-york-elections.html,%2520https://www.nytimes.com/interactive/2018/11/06/us/elections/results-new-york-elections.html
  92. NBC News
    https://www.nbcnews.com/politics/politics-news/fraud-allegations-leave-north-carolina-house-race-unresolved-no-clear-n942816
  93. Carolina Journal
    https://www.carolinajournal.com/news-article/cooper-ditches-call-for-interim-elections-board-9th-district-hearing-postponed
  94. The Washington Post
    https://www.washingtonpost.com/politics/candidate-says-new-congressional-election-warranted-in-north-carolina/2019/02/21/acae4482-35e0-11e9-854a-7a14d7fec96a_story.html
  95. The New York Times
    https://www.nytimes.com/interactive/2018/11/06/us/elections/results-north-carolina-elections.html,%2520https://www.nytimes.com/interactive/2018/11/06/us/elections/results-north-carolina-elections.html
  96. The New York Times
    https://www.nytimes.com/interactive/2018/11/06/us/elections/results-north-dakota-elections.html,%2520https://www.nytimes.com/interactive/2018/11/06/us/elections/results-north-dakota-elections.html
  97. The New York Times
    https://www.nytimes.com/interactive/2018/11/06/us/elections/results-ohio-elections.html,%2520https://www.nytimes.com/interactive/2018/11/06/us/elections/results-ohio-elections.html
  98. "Let's turn TN into OK!- Libertarian Party"
    https://www.lp.org/lets-turn-tn-ok
  99. The New York Times
    https://www.nytimes.com/interactive/2018/11/06/us/elections/results-oklahoma-elections.html,%2520https://www.nytimes.com/interactive/2018/11/06/us/elections/results-oklahoma-elections.html
  100. The New York Times
    https://www.nytimes.com/interactive/2018/11/06/us/elections/results-oregon-elections.html,%2520https://www.nytimes.com/interactive/2018/11/06/us/elections/results-oregon-elections.html
  101. The New York Times
    https://www.nytimes.com/interactive/2018/11/06/us/elections/results-pennsylvania-elections.html,%2520https://www.nytimes.com/interactive/2018/11/06/us/elections/results-pennsylvania-elections.html
  102. The New York Times
    https://www.nytimes.com/interactive/2018/11/06/us/elections/results-rhode-island-elections.html,%2520https://www.nytimes.com/interactive/2018/11/06/us/elections/results-rhode-island-elections.html
  103. The New York Times
    https://www.nytimes.com/interactive/2018/11/06/us/elections/results-south-carolina-elections.html,%2520https://www.nytimes.com/interactive/2018/11/06/us/elections/results-south-carolina-elections.html
  104. The New York Times
    https://www.nytimes.com/interactive/2018/11/06/us/elections/results-south-dakota-elections.html,%2520https://www.nytimes.com/interactive/2018/11/06/us/elections/results-south-dakota-elections.html
  105. The New York Times
    https://www.nytimes.com/interactive/2018/11/06/us/elections/results-tennessee-elections.html,%2520https://www.nytimes.com/interactive/2018/11/06/us/elections/results-tennessee-elections.html
  106. The New York Times
    https://www.nytimes.com/interactive/2018/11/06/us/elections/results-texas-elections.html,%2520https://www.nytimes.com/interactive/2018/11/06/us/elections/results-texas-elections.html
  107. The New York Times
    https://www.nytimes.com/interactive/2018/11/06/us/elections/results-utah-elections.html,%2520https://www.nytimes.com/interactive/2018/11/06/us/elections/results-utah-elections.html
  108. The New York Times
    https://www.nytimes.com/interactive/2018/11/06/us/elections/results-vermont-elections.html,%2520https://www.nytimes.com/interactive/2018/11/06/us/elections/results-vermont-elections.html
  109. The New York Times
    https://www.nytimes.com/interactive/2018/11/06/us/elections/results-virginia-elections.html,%2520https://www.nytimes.com/interactive/2018/11/06/us/elections/results-virginia-elections.html
  110. The New York Times
    https://www.nytimes.com/interactive/2018/11/06/us/elections/results-washington-elections.html,%2520https://www.nytimes.com/interactive/2018/11/06/us/elections/results-washington-elections.html
  111. The New York Times
    https://www.nytimes.com/interactive/2018/11/06/us/elections/results-west-virginia-elections.html,%2520https://www.nytimes.com/interactive/2018/11/06/us/elections/results-west-virginia-elections.html
  112. The New York Times
    https://www.nytimes.com/interactive/2018/11/06/us/elections/results-wisconsin-elections.html,%2520https://www.nytimes.com/interactive/2018/11/06/us/elections/results-wisconsin-elections.html
  113. The New York Times
    https://www.nytimes.com/interactive/2018/11/06/us/elections/results-wyoming-elections.html,%2520https://www.nytimes.com/interactive/2018/11/06/us/elections/results-wyoming-elections.html
  114. Pasquines
    https://pasquines.us/2018/10/11/lacking-full-representation-residents-of-us-territories-prepare-to-vote-in-2018
  115. Radio New Zealand International
    https://www.radionz.co.nz/international/pacific-news/365714/american-samoa-candidates-line-up-for-november-poll
  116. The New York Times
    https://www.nytimes.com/interactive/2018/11/06/us/elections/results-district-of-columbia-elections.html,%2520https://www.nytimes.com/interactive/2018/11/06/us/elections/results-district-of-columbia-elections.html
  117. Guam Election Commission
    https://web.archive.org/web/20180703221338/https://gec.guam.gov/index.php/elections/candidates-for-2018-primary-election-and-special-election
  118. "General Election Official Summary"
    https://web.archive.org/web/20201125230556/https://gec.guam.gov/wp-content/uploads/2018/11/2018-ge-official-summary.htm
  119. Honolulu Star-Advertiser
    http://www.staradvertiser.com/2018/10/29/breaking-news/northern-mariana-islands-elections-delayed-as-community-recovers-from-devastating-super-typhoon-yutu
  120. The Guam Daily Post
    https://www.postguam.com/news/cnmi/sablan-allegations-of-cnmi-voter-intimidation/article_aa981e06-e186-11e8-b4b1-f3b2b9b2d83f.html
  121. Saipan Tribune
    https://www.saipantribune.com/index.php/sablan-files-candidacy-to-seek-6th-term
  122. Marianas Variety
    http://www.mvariety.com/cnmi/cnmi-news/local/100041-rep-angel-demapan-we-need-fresh-voice-in-dc
  123. The St. Croix Source
    https://web.archive.org/web/20180613062521/https://stcroixsource.com/2018/05/09/the-final-lineup-120-candidates-seeking-office-in-v-i
  124. "2018 General Election Results"
    https://www.vivote.gov/sites/default/files/officialresults/Certification%20of%20the%202018%20General%20Election.pdf
Image
Source:
Tip: Wheel or +/− to zoom, drag to pan, Esc to close.