Topzle Topzle

1996 United States presidential election

Updated: Wikipedia source

1996 United States presidential election

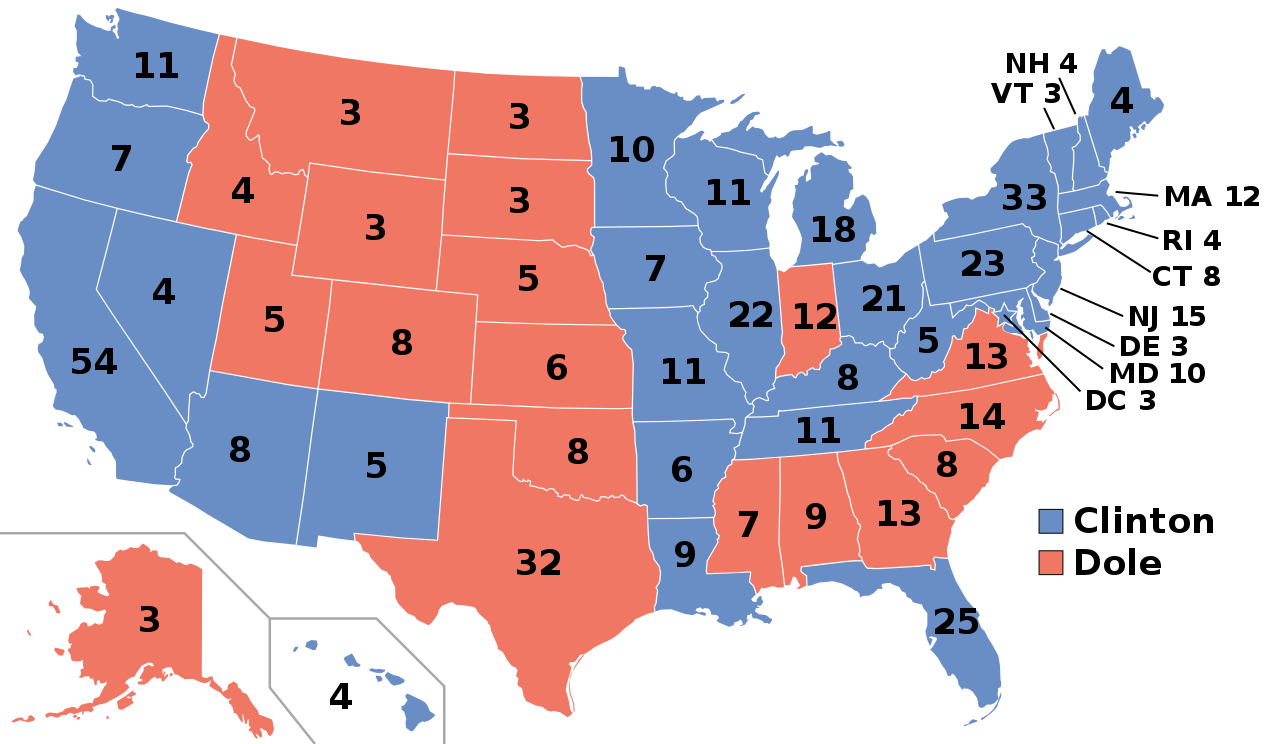
Presidential elections were held in the United States on November 5, 1996. Incumbent Democratic President Bill Clinton and his running mate, incumbent Vice President Al Gore, were elected to a second term. They defeated the Republican ticket of former Senate Majority Leader Bob Dole and former Secretary of Housing and Urban Development Jack Kemp and the Reform ticket of businessman Ross Perot and economist Pat Choate. Clinton and Vice President Gore were re-nominated without incident by the Democratic Party. Numerous candidates entered the 1996 Republican primaries, with Dole considered the early frontrunner. Dole clinched the nomination after defeating challenges by publisher Steve Forbes and paleoconservative leader Pat Buchanan. Dole's running mate was Jack Kemp, a former New York congressman and football player who had served as the housing secretary under President George H. W. Bush. Ross Perot, who had won 18.9% of the popular vote as an independent candidate in 1992, ran as the candidate of the Reform Party. Perot received less media attention in 1996 and was excluded from the presidential debates. Clinton's chances of winning were initially considered slim in the middle of his term, as his party had lost both the House of Representatives and the Senate in 1994 for the first time in decades. He was able to regain ground as the economy began to recover from the early 1990s recession with a relatively stable world stage. Clinton tied Dole to Newt Gingrich, the arch-conservative Republican speaker of the House, and expressed concern that Republicans would increase the deficit and slash spending on popular programs like Social Security and Medicare. Dole promised an across-the-board 15% reduction in federal income taxes and labeled Clinton as a "spoiled" Baby Boomer who "never grew up" and "never sacrificed." Dole's age was a persistent issue in the election, and gaffes by Dole exacerbated the issue for his campaign. On election day, Clinton defeated Dole by a wide margin, winning 379 electors to Dole's 159 and taking 49.2% of the national popular vote to Dole's 40.7%. As in 1992, Perot's strong candidacy held both major party candidates below 50% nationwide. Notably, Clinton's strength with many southern and rural whites makes him the last Democrat to carry the states of Kentucky, Louisiana, West Virginia, Arkansas, Missouri, and Tennessee in a presidential election. He was also the last Democrat to win Arizona until 2020. This is also the last election where either major party nominee would get under 50,000,000 votes.

Infobox

Party
Democratic
Nominee
Bill Clinton
Turnout
51.7% 6.4 pp
Percentage
49.2%
Home state
Arkansas
Popular vote
47,402,357
Running mate
Al Gore
Electoral vote
379
States carried
31 DC

Tables

· Democratic Party nomination
Bill Clinton
Bill Clinton
Democratic Party (United States)1996 Democratic Party ticket
Bill Clinton
Democratic Party (United States)1996 Democratic Party ticket
Al Gore
for President
for President
Democratic Party (United States)1996 Democratic Party ticket
for President
Democratic Party (United States)1996 Democratic Party ticket
for Vice President
42nd President of the United States(1993–2001)
Democratic Party (United States)1996 Democratic Party ticket
42nd President of the United States(1993–2001)
Democratic Party (United States)1996 Democratic Party ticket
45thVice President of the United States(1993–2001)
Campaign
Campaign
Democratic Party (United States)1996 Democratic Party ticket
Campaign
Democratic Party (United States)1996 Democratic Party ticket
Bill Clinton
Al Gore
for President
for Vice President
42nd President of the United States(1993–2001)
45thVice President of the United States(1993–2001)
Campaign
· Republican Party nomination
Bob Dole
Bob Dole
Republican Party (United States)1996 Republican Party ticket
Bob Dole
Republican Party (United States)1996 Republican Party ticket
Jack Kemp
for President
for President
Republican Party (United States)1996 Republican Party ticket
for President
Republican Party (United States)1996 Republican Party ticket
for Vice President
U.S. Senator from Kansas(1969–1996)
Republican Party (United States)1996 Republican Party ticket
U.S. Senator from Kansas(1969–1996)
Republican Party (United States)1996 Republican Party ticket
9thU.S. Secretary of Housing and Urban Development(1989–1993)
Campaign
Campaign
Republican Party (United States)1996 Republican Party ticket
Campaign
Republican Party (United States)1996 Republican Party ticket
Bob Dole
Jack Kemp
for President
for Vice President
Senator from Kansas(1969–1996)
9thU.S. Secretary of Housing and Urban Development(1989–1993)
Campaign
· Republican Party nomination › Withdrawn candidates
Pat Buchanan
Pat Buchanan
Candidates in this section are sorted by popular vote from the primaries
Pat Buchanan
Candidates in this section are sorted by popular vote from the primaries
Steve Forbes
Candidates in this section are sorted by popular vote from the primaries
Lamar Alexander
Candidates in this section are sorted by popular vote from the primaries
Richard Lugar
Candidates in this section are sorted by popular vote from the primaries
Phil Gramm
White House Communications Director(1985–1987)
Candidates in this section are sorted by popular vote from the primaries
White House Communications Director(1985–1987)
Candidates in this section are sorted by popular vote from the primaries
Publisher and editor-in-chief of Forbes magazine(1990–)
Candidates in this section are sorted by popular vote from the primaries
United States Secretary of Education(1991–1993)
Candidates in this section are sorted by popular vote from the primaries
United States Senator from Indiana(1977–2013)
Candidates in this section are sorted by popular vote from the primaries
United States Senator from Texas(1985–2002)
Campaign
Campaign
Candidates in this section are sorted by popular vote from the primaries
Campaign
LN: August 153,184,943 votes
Candidates in this section are sorted by popular vote from the primaries
LN: August 153,184,943 votes
Candidates in this section are sorted by popular vote from the primaries
W: March 141,751,187 votes
Candidates in this section are sorted by popular vote from the primaries
W: March 9495,590 votes
Candidates in this section are sorted by popular vote from the primaries
W: March 9127,111 votes
Candidates in this section are sorted by popular vote from the primaries
Pat Buchanan
Steve Forbes
Lamar Alexander
Richard Lugar
Phil Gramm
White House Communications Director(1985–1987)
Publisher and editor-in-chief of Forbes magazine(1990–)
United States Secretary of Education(1991–1993)
United States Senator from Indiana(1977–2013)
United States Senator from Texas(1985–2002)
Campaign
LN: August 153,184,943 votes
W: March 141,751,187 votes
W: March 9495,590 votes
W: March 9127,111 votes
· Reform Party nomination
Ross Perot
Ross Perot
1996 Reform Party ticket
Ross Perot
1996 Reform Party ticket
Pat Choate
for President
for President
1996 Reform Party ticket
for President
1996 Reform Party ticket
for Vice President
President and CEO of Perot Systems (1988–2009)
1996 Reform Party ticket
President and CEO of Perot Systems (1988–2009)
1996 Reform Party ticket
Economist
Campaign
Campaign
1996 Reform Party ticket
Campaign
1996 Reform Party ticket
Ross Perot
Pat Choate
for President
for Vice President
President and CEO of Perot Systems (1988–2009)
Economist
Campaign
· Minor parties and independents
Libertarian
Libertarian
Minor party candidates, 1996
Libertarian
Minor party candidates, 1996
Green
Minor party candidates, 1996
Natural Law
Minor party candidates, 1996
U.S. Taxpayers'
Harry Browne
Harry Browne
Minor party candidates, 1996
Harry Browne
Minor party candidates, 1996
Ralph Nader
Minor party candidates, 1996
John Hagelin
Minor party candidates, 1996
Howard Phillips
Investment analyst
Investment analyst
Minor party candidates, 1996
Investment analyst
Minor party candidates, 1996
Author and consumer advocate
Minor party candidates, 1996
Scientist and researcher
Minor party candidates, 1996
Conservative political activist
Minor party candidates, 1996
Libertarian
Green
Natural Law
Taxpayers'
Harry Browne
Ralph Nader
John Hagelin
Howard Phillips
Investment analyst
Author and consumer advocate
Scientist and researcher
Conservative political activist
Balloting · Minor parties and independents › Libertarian Party nomination
Harry Browne
Harry Browne
Presidential ballot
Harry Browne
1st
416
Rick Tompkins
Rick Tompkins
Presidential ballot
Rick Tompkins
1st
74
None
None
Presidential ballot
None
1st
61
Irwin Schiff
Irwin Schiff
Presidential ballot
Irwin Schiff
1st
32
Douglas J. Ohmen
Douglas J. Ohmen
Presidential ballot
Douglas J. Ohmen
1st
20
Jeffrey Diket
Jeffrey Diket
Presidential ballot
Jeffrey Diket
1st
1
Jo Jorgensen
Jo Jorgensen
Presidential ballot
Jo Jorgensen
1st
1
Presidential ballot
1st
Harry Browne
416
Rick Tompkins
74
None
61
Irwin Schiff
32
Douglas J. Ohmen
20
Jeffrey Diket
1
Jo Jorgensen
1
Debates among candidates for the 1996 U.S. presidential election · General election › Presidential debates
P1
P1
No.
P1
Date
Sunday, October 6, 1996
Host
Bushnell Center for the Performing Arts
Location
Hartford, Connecticut
Moderators
Jim Lehrer
Participants
President Bill ClintonSenator Bob Dole
Viewership(millions)
46.1
VP
VP
No.
VP
Date
Wednesday, October 9, 1996
Host
Mahaffey Theater
Location
St. Petersburg, Florida
Moderators
Jim Lehrer
Participants
Vice President Al GoreSecretary Jack Kemp
Viewership(millions)
26.6
P2
P2
No.
P2
Date
Wednesday, October 16, 1996
Host
University of San Diego
Location
San Diego, California
Moderators
Jim Lehrer
Participants
President Bill ClintonSenator Bob Dole
Viewership(millions)
36.6
No.
Date
Host
Location
Moderators
Participants
Viewership(millions)
P1
Sunday, October 6, 1996
Bushnell Center for the Performing Arts
Hartford, Connecticut
Jim Lehrer
President Bill ClintonSenator Bob Dole
46.1
VP
Wednesday, October 9, 1996
Mahaffey Theater
St. Petersburg, Florida
Jim Lehrer
Vice President Al GoreSecretary Jack Kemp
26.6
P2
Wednesday, October 16, 1996
University of San Diego
San Diego, California
Jim Lehrer
President Bill ClintonSenator Bob Dole
36.6
Electoral results · Results
Count
Count
Presidential candidate
Count
Party
Percentage
Home state
Vice-presidential candidate
Popular vote
Home state
Popular vote
Electoral vote
Bill Clinton (incumbent)
Presidential candidate
Bill Clinton (incumbent)
Party
Democratic
Home state
Arkansas
Popular vote
47,402,357
Popular vote
49.24%
Electoralvote
379
Running mate
Al Gore (incumbent)
Running mate
Tennessee
Running mate
379
Bob Dole
Bob Dole
Presidential candidate
Bob Dole
Party
Republican
Home state
Kansas
Popular vote
39,198,755
Popular vote
40.71%
Electoralvote
159
Running mate
Jack Kemp
Running mate
New York
Running mate
159
Ross Perot
Ross Perot
Presidential candidate
Ross Perot
Party
Reform
Home state
Texas
Popular vote
8,085,402
Popular vote
8.40%
Electoralvote
0
Running mate
Patrick Choate
Running mate
Washington, D.C.
Running mate
0
Ralph Nader
Ralph Nader
Presidential candidate
Ralph Nader
Party
Green
Home state
Connecticut
Popular vote
684,902
Popular vote
0.71%
Electoralvote
0
Running mate
Winona LaDuke
Running mate
California
Running mate
0
Harry Browne
Harry Browne
Presidential candidate
Harry Browne
Party
Libertarian
Home state
Tennessee
Popular vote
485,798
Popular vote
0.50%
Electoralvote
0
Running mate
Jo Jorgensen
Running mate
South Carolina
Running mate
0
Howard Phillips
Howard Phillips
Presidential candidate
Howard Phillips
Party
Taxpayers
Home state
Virginia
Popular vote
184,658
Popular vote
0.19%
Electoralvote
0
Running mate
Herbert Titus
Running mate
Oregon
Running mate
0
John Hagelin
John Hagelin
Presidential candidate
John Hagelin
Party
Natural Law
Home state
Iowa
Popular vote
113,668
Popular vote
0.12%
Electoralvote
0
Running mate
Mike Tompkins
Running mate
Massachusetts
Running mate
0
Other
Other
Presidential candidate
Other
Party
121,683
Home state
0.13%
Popular vote
Popular vote
Other
Electoralvote
Total
Total
Presidential candidate
Total
Party
96,277,223
Home state
100%
Popular vote
538
Electoralvote
538
Needed to win
Needed to win
Presidential candidate
Needed to win
Party
270
Popular vote
270
Presidential candidate
Party
Home state
Popular vote
Electoralvote
Running mate
Count
Percentage
Vice-presidential candidate
Home state
Electoral vote
Bill Clinton (incumbent)
Democratic
Arkansas
47,402,357
49.24%
379
Al Gore (incumbent)
Tennessee
379
Bob Dole
Republican
Kansas
39,198,755
40.71%
159
Jack Kemp
New York
159
Ross Perot
Reform
Texas
8,085,402
8.40%
0
Patrick Choate
Washington, D.C.
0
Ralph Nader
Green
Connecticut
684,902
0.71%
0
Winona LaDuke
California
0
Harry Browne
Libertarian
Tennessee
485,798
0.50%
0
Jo Jorgensen
South Carolina
0
Howard Phillips
Taxpayers
Virginia
184,658
0.19%
0
Herbert Titus
Oregon
0
John Hagelin
Natural Law
Iowa
113,668
0.12%
0
Mike Tompkins
Massachusetts
0
Other
121,683
0.13%
Other
Total
96,277,223
100%
538
538
Needed to win
270
270
Legend · Results › Results by state
States/districts won by Dole/Kemp
States/districts won by Clinton/Gore
States/districts won by Dole/Kemp
States/districts won by Clinton/Gore
At-large results (for states that split electoral votes)
States/districts won by Clinton/Gore
States/districts won by Dole/Kemp
At-large results (for states that split electoral votes)
State
State
Col 1
State
Col 2
elec­toralvotes
Bill ClintonDemocratic
#
Bill ClintonDemocratic
%
Bill ClintonDemocratic
elec­toralvotes
Bob DoleRepublican
#
Bob DoleRepublican
%
Bob DoleRepublican
elec­toralvotes
Ross PerotReform
#
Ross PerotReform
%
Ross PerotReform
elec­toralvotes
Ralph NaderGreen
#
Ralph NaderGreen
%
Ralph NaderGreen
elec­toralvotes
Harry BrowneLibertarian
#
Harry BrowneLibertarian
%
Harry BrowneLibertarian
elec­toralvotes
Others
#
Others
%
Others
elec­toralvotes
Margin
#
Margin
%
MarginSwing
%
State Total
#
Alabama
Alabama
Col 1
Alabama
Col 2
9
Bill ClintonDemocratic
662,165
Bill ClintonDemocratic
43.16%
Bill ClintonDemocratic
Bob DoleRepublican
769,044
Bob DoleRepublican
50.12%
Bob DoleRepublican
9
Ross PerotReform
92,149
Ross PerotReform
6.01%
Ross PerotReform
Ralph NaderGreen
Ralph NaderGreen
Ralph NaderGreen
Harry BrowneLibertarian
5,290
Harry BrowneLibertarian
0.34%
Harry BrowneLibertarian
Others
5,701
Others
0.37%
Others
Margin
−106,879
Margin
−6.96%
MarginSwing
−0.19%
State Total
1,534,349
State Total
AL
Alaska
Alaska
Col 1
Alaska
Col 2
3
Bill ClintonDemocratic
80,380
Bill ClintonDemocratic
33.27%
Bill ClintonDemocratic
Bob DoleRepublican
122,746
Bob DoleRepublican
50.80%
Bob DoleRepublican
3
Ross PerotReform
26,333
Ross PerotReform
10.90%
Ross PerotReform
Ralph NaderGreen
7,597
Ralph NaderGreen
3.14%
Ralph NaderGreen
Harry BrowneLibertarian
2,276
Harry BrowneLibertarian
0.94%
Harry BrowneLibertarian
Others
2,288
Others
0.95%
Others
Margin
−42,366
Margin
−17.53%
MarginSwing
−8.36%
State Total
241,620
State Total
AK
Arizona
Arizona
Col 1
Arizona
Col 2
8
Bill ClintonDemocratic
653,288
Bill ClintonDemocratic
46.52%
Bill ClintonDemocratic
8
Bob DoleRepublican
622,073
Bob DoleRepublican
44.29%
Bob DoleRepublican
Ross PerotReform
112,072
Ross PerotReform
7.98%
Ross PerotReform
Ralph NaderGreen
2,062
Ralph NaderGreen
0.15%
Ralph NaderGreen
Harry BrowneLibertarian
14,358
Harry BrowneLibertarian
1.02%
Harry BrowneLibertarian
Others
552
Others
0.04%
Others
Margin
31,215
Margin
2.23%
MarginSwing
4.18%
State Total
1,404,405
State Total
AZ
Arkansas
Arkansas
Col 1
Arkansas
Col 2
6
Bill ClintonDemocratic
475,171
Bill ClintonDemocratic
53.74%
Bill ClintonDemocratic
6
Bob DoleRepublican
325,416
Bob DoleRepublican
36.80%
Bob DoleRepublican
Ross PerotReform
69,884
Ross PerotReform
7.90%
Ross PerotReform
Ralph NaderGreen
3,649
Ralph NaderGreen
0.41%
Ralph NaderGreen
Harry BrowneLibertarian
3,076
Harry BrowneLibertarian
0.35%
Harry BrowneLibertarian
Others
7,066
Others
0.80%
Others
Margin
149,755
Margin
16.94%
MarginSwing
−0.79%
State Total
884,262
State Total
AR
California
California
Col 1
California
Col 2
54
Bill ClintonDemocratic
5,119,835
Bill ClintonDemocratic
51.10%
Bill ClintonDemocratic
54
Bob DoleRepublican
3,828,380
Bob DoleRepublican
38.21%
Bob DoleRepublican
Ross PerotReform
697,847
Ross PerotReform
6.96%
Ross PerotReform
Ralph NaderGreen
237,016
Ralph NaderGreen
2.37%
Ralph NaderGreen
Harry BrowneLibertarian
73,600
Harry BrowneLibertarian
0.73%
Harry BrowneLibertarian
Others
62,806
Others
0.63%
Others
Margin
1,291,455
Margin
12.89%
MarginSwing
−0.51%
State Total
10,019,484
State Total
CA
Colorado
Colorado
Col 1
Colorado
Col 2
8
Bill ClintonDemocratic
671,152
Bill ClintonDemocratic
44.43%
Bill ClintonDemocratic
Bob DoleRepublican
691,848
Bob DoleRepublican
45.80%
Bob DoleRepublican
8
Ross PerotReform
99,629
Ross PerotReform
6.59%
Ross PerotReform
Ralph NaderGreen
25,070
Ralph NaderGreen
1.66%
Ralph NaderGreen
Harry BrowneLibertarian
12,392
Harry BrowneLibertarian
0.82%
Harry BrowneLibertarian
Others
10,613
Others
0.70%
Others
Margin
−20,696
Margin
−1.37%
MarginSwing
−5.63%
State Total
1,510,704
State Total
CO
Connecticut
Connecticut
Col 1
Connecticut
Col 2
8
Bill ClintonDemocratic
735,740
Bill ClintonDemocratic
52.83%
Bill ClintonDemocratic
8
Bob DoleRepublican
483,109
Bob DoleRepublican
34.69%
Bob DoleRepublican
Ross PerotReform
139,523
Ross PerotReform
10.02%
Ross PerotReform
Ralph NaderGreen
24,321
Ralph NaderGreen
1.75%
Ralph NaderGreen
Harry BrowneLibertarian
5,788
Harry BrowneLibertarian
0.42%
Harry BrowneLibertarian
Others
4,133
Others
0.30%
Others
Margin
252,631
Margin
18.14%
MarginSwing
11.71%
State Total
1,392,614
State Total
CT
Delaware
Delaware
Col 1
Delaware
Col 2
3
Bill ClintonDemocratic
140,355
Bill ClintonDemocratic
51.80%
Bill ClintonDemocratic
3
Bob DoleRepublican
99,062
Bob DoleRepublican
36.58%
Bob DoleRepublican
Ross PerotReform
28,719
Ross PerotReform
10.60%
Ross PerotReform
Ralph NaderGreen
18
Ralph NaderGreen
0.01%
Ralph NaderGreen
Harry BrowneLibertarian
2,052
Harry BrowneLibertarian
0.76%
Harry BrowneLibertarian
Others
639
Others
0.24%
Others
Margin
41,293
Margin
15.22%
MarginSwing
7.03%
State Total
270,845
State Total
DE
D.C.
D.C.
Col 1
D.C.
Col 2
3
Bill ClintonDemocratic
158,220
Bill ClintonDemocratic
85.19%
Bill ClintonDemocratic
3
Bob DoleRepublican
17,339
Bob DoleRepublican
9.34%
Bob DoleRepublican
Ross PerotReform
3,611
Ross PerotReform
1.94%
Ross PerotReform
Ralph NaderGreen
4,780
Ralph NaderGreen
2.57%
Ralph NaderGreen
Harry BrowneLibertarian
588
Harry BrowneLibertarian
0.32%
Harry BrowneLibertarian
Others
1,188
Others
0.64%
Others
Margin
140,881
Margin
75.85%
MarginSwing
0.23%
State Total
185,726
State Total
DC
Florida
Florida
Col 1
Florida
Col 2
25
Bill ClintonDemocratic
2,546,870
Bill ClintonDemocratic
48.02%
Bill ClintonDemocratic
25
Bob DoleRepublican
2,244,536
Bob DoleRepublican
42.32%
Bob DoleRepublican
Ross PerotReform
483,870
Ross PerotReform
9.12%
Ross PerotReform
Ralph NaderGreen
4,101
Ralph NaderGreen
0.08%
Ralph NaderGreen
Harry BrowneLibertarian
23,965
Harry BrowneLibertarian
0.45%
Harry BrowneLibertarian
Others
452
Others
0.01%
Others
Margin
302,334
Margin
5.70%
MarginSwing
7.59%
State Total
5,303,794
State Total
FL
Georgia
Georgia
Col 1
Georgia
Col 2
13
Bill ClintonDemocratic
1,053,849
Bill ClintonDemocratic
45.84%
Bill ClintonDemocratic
Bob DoleRepublican
1,080,843
Bob DoleRepublican
47.01%
Bob DoleRepublican
13
Ross PerotReform
146,337
Ross PerotReform
6.37%
Ross PerotReform
Ralph NaderGreen
Ralph NaderGreen
Ralph NaderGreen
Harry BrowneLibertarian
17,870
Harry BrowneLibertarian
0.78%
Harry BrowneLibertarian
Others
172
Others
0.01%
Others
Margin
−26,994
Margin
−1.17%
MarginSwing
−1.76%
State Total
2,299,071
State Total
GA
Hawaii
Hawaii
Col 1
Hawaii
Col 2
4
Bill ClintonDemocratic
205,012
Bill ClintonDemocratic
56.93%
Bill ClintonDemocratic
4
Bob DoleRepublican
113,943
Bob DoleRepublican
31.64%
Bob DoleRepublican
Ross PerotReform
27,358
Ross PerotReform
7.60%
Ross PerotReform
Ralph NaderGreen
10,386
Ralph NaderGreen
2.88%
Ralph NaderGreen
Harry BrowneLibertarian
2,493
Harry BrowneLibertarian
0.69%
Harry BrowneLibertarian
Others
928
Others
0.26%
Others
Margin
91,069
Margin
25.29%
MarginSwing
13.90%
State Total
360,120
State Total
HI
Idaho
Idaho
Col 1
Idaho
Col 2
4
Bill ClintonDemocratic
165,443
Bill ClintonDemocratic
33.65%
Bill ClintonDemocratic
Bob DoleRepublican
256,595
Bob DoleRepublican
52.18%
Bob DoleRepublican
4
Ross PerotReform
62,518
Ross PerotReform
12.71%
Ross PerotReform
Ralph NaderGreen
Ralph NaderGreen
Ralph NaderGreen
Harry BrowneLibertarian
3,325
Harry BrowneLibertarian
0.68%
Harry BrowneLibertarian
Others
3,838
Others
0.78%
Others
Margin
−91,152
Margin
−18.53%
MarginSwing
−4.92%
State Total
491,719
State Total
ID
Illinois
Illinois
Col 1
Illinois
Col 2
22
Bill ClintonDemocratic
2,341,744
Bill ClintonDemocratic
54.32%
Bill ClintonDemocratic
22
Bob DoleRepublican
1,587,021
Bob DoleRepublican
36.81%
Bob DoleRepublican
Ross PerotReform
346,408
Ross PerotReform
8.03%
Ross PerotReform
Ralph NaderGreen
1,447
Ralph NaderGreen
0.03%
Ralph NaderGreen
Harry BrowneLibertarian
22,548
Harry BrowneLibertarian
0.52%
Harry BrowneLibertarian
Others
12,223
Others
0.29%
Others
Margin
754,723
Margin
17.51%
MarginSwing
3.27%
State Total
4,311,391
State Total
IL
Indiana
Indiana
Col 1
Indiana
Col 2
12
Bill ClintonDemocratic
887,424
Bill ClintonDemocratic
41.55%
Bill ClintonDemocratic
Bob DoleRepublican
1,006,693
Bob DoleRepublican
47.13%
Bob DoleRepublican
12
Ross PerotReform
224,299
Ross PerotReform
10.50%
Ross PerotReform
Ralph NaderGreen
1,121
Ralph NaderGreen
0.05%
Ralph NaderGreen
Harry BrowneLibertarian
15,632
Harry BrowneLibertarian
0.73%
Harry BrowneLibertarian
Others
673
Others
0.03%
Others
Margin
−119,269
Margin
−5.58%
MarginSwing
0.54%
State Total
2,135,842
State Total
IN
Iowa
Iowa
Col 1
Iowa
Col 2
7
Bill ClintonDemocratic
620,258
Bill ClintonDemocratic
50.26%
Bill ClintonDemocratic
7
Bob DoleRepublican
492,644
Bob DoleRepublican
39.92%
Bob DoleRepublican
Ross PerotReform
105,159
Ross PerotReform
8.52%
Ross PerotReform
Ralph NaderGreen
6,550
Ralph NaderGreen
0.53%
Ralph NaderGreen
Harry BrowneLibertarian
2,315
Harry BrowneLibertarian
0.19%
Harry BrowneLibertarian
Others
7,149
Others
0.58%
Others
Margin
127,614
Margin
10.34%
MarginSwing
4.32%
State Total
1,234,075
State Total
IA
Kansas
Kansas
Col 1
Kansas
Col 2
6
Bill ClintonDemocratic
387,659
Bill ClintonDemocratic
36.08%
Bill ClintonDemocratic
Bob DoleRepublican
583,245
Bob DoleRepublican
54.29%
Bob DoleRepublican
6
Ross PerotReform
92,639
Ross PerotReform
8.62%
Ross PerotReform
Ralph NaderGreen
914
Ralph NaderGreen
0.09%
Ralph NaderGreen
Harry BrowneLibertarian
4,557
Harry BrowneLibertarian
0.42%
Harry BrowneLibertarian
Others
5,286
Others
0.49%
Others
Margin
−195,586
Margin
−18.21%
MarginSwing
−13.07%
State Total
1,074,300
State Total
KS
Kentucky
Kentucky
Col 1
Kentucky
Col 2
8
Bill ClintonDemocratic
636,614
Bill ClintonDemocratic
45.84%
Bill ClintonDemocratic
8
Bob DoleRepublican
623,283
Bob DoleRepublican
44.88%
Bob DoleRepublican
Ross PerotReform
120,396
Ross PerotReform
8.67%
Ross PerotReform
Ralph NaderGreen
701
Ralph NaderGreen
0.05%
Ralph NaderGreen
Harry BrowneLibertarian
4,009
Harry BrowneLibertarian
0.29%
Harry BrowneLibertarian
Others
3,705
Others
0.27%
Others
Margin
13,331
Margin
0.96%
MarginSwing
−2.25%
State Total
1,388,708
State Total
KY
Louisiana
Louisiana
Col 1
Louisiana
Col 2
9
Bill ClintonDemocratic
927,837
Bill ClintonDemocratic
52.01%
Bill ClintonDemocratic
9
Bob DoleRepublican
712,586
Bob DoleRepublican
39.94%
Bob DoleRepublican
Ross PerotReform
123,293
Ross PerotReform
6.91%
Ross PerotReform
Ralph NaderGreen
4,719
Ralph NaderGreen
0.26%
Ralph NaderGreen
Harry BrowneLibertarian
7,499
Harry BrowneLibertarian
0.42%
Harry BrowneLibertarian
Others
8,025
Others
0.45%
Others
Margin
215,251
Margin
12.07%
MarginSwing
7.46%
State Total
1,783,959
State Total
LA
Maine†
Maine†
Col 1
Maine†
Col 2
2
Bill ClintonDemocratic
312,788
Bill ClintonDemocratic
51.62%
Bill ClintonDemocratic
2
Bob DoleRepublican
186,378
Bob DoleRepublican
30.76%
Bob DoleRepublican
Ross PerotReform
85,970
Ross PerotReform
14.19%
Ross PerotReform
Ralph NaderGreen
15,279
Ralph NaderGreen
2.52%
Ralph NaderGreen
Harry BrowneLibertarian
2,996
Harry BrowneLibertarian
0.49%
Harry BrowneLibertarian
Others
2,486
Others
0.41%
Others
Margin
126,410
Margin
20.86%
MarginSwing
12.48%
State Total
605,897
State Total
ME
Maine-1
Maine-1
Col 1
Maine-1
Col 2
1
Bill ClintonDemocratic
165,053
Bill ClintonDemocratic
52.1%
Bill ClintonDemocratic
1
Bob DoleRepublican
100,851
Bob DoleRepublican
31.8%
Bob DoleRepublican
Ross PerotReform
39,845
Ross PerotReform
12.6%
Ross PerotReform
Ralph NaderGreen
Ralph NaderGreen
Ralph NaderGreen
Harry BrowneLibertarian
Others
11,372
Others
3.6%
Others
Margin
64,202
Margin
20.3%
MarginSwing
12.19%
State Total
317,121
State Total
ME1
Maine-2
Maine-2
Col 1
Maine-2
Col 2
1
Bill ClintonDemocratic
147,735
Bill ClintonDemocratic
51.2%
Bill ClintonDemocratic
1
Bob DoleRepublican
85,527
Bob DoleRepublican
29.6%
Bob DoleRepublican
Ross PerotReform
46,125
Ross PerotReform
16.0%
Ross PerotReform
Ralph NaderGreen
Ralph NaderGreen
Ralph NaderGreen
Harry BrowneLibertarian
Others
9,389
Others
3.3%
Others
Margin
62,208
Margin
21.5%
MarginSwing
12.70%
State Total
288,776
State Total
ME2
Maryland
Maryland
Col 1
Maryland
Col 2
10
Bill ClintonDemocratic
966,207
Bill ClintonDemocratic
54.25%
Bill ClintonDemocratic
10
Bob DoleRepublican
681,530
Bob DoleRepublican
38.27%
Bob DoleRepublican
Ross PerotReform
115,812
Ross PerotReform
6.50%
Ross PerotReform
Ralph NaderGreen
2,606
Ralph NaderGreen
0.15%
Ralph NaderGreen
Harry BrowneLibertarian
8,765
Harry BrowneLibertarian
0.49%
Harry BrowneLibertarian
Others
5,950
Others
0.33%
Others
Margin
284,677
Margin
15.98%
MarginSwing
1.80%
State Total
1,780,870
State Total
MD
Massachusetts
Massachusetts
Col 1
Massachusetts
Col 2
12
Bill ClintonDemocratic
1,571,763
Bill ClintonDemocratic
61.47%
Bill ClintonDemocratic
12
Bob DoleRepublican
718,107
Bob DoleRepublican
28.08%
Bob DoleRepublican
Ross PerotReform
227,217
Ross PerotReform
8.89%
Ross PerotReform
Ralph NaderGreen
4,565
Ralph NaderGreen
0.18%
Ralph NaderGreen
Harry BrowneLibertarian
20,426
Harry BrowneLibertarian
0.80%
Harry BrowneLibertarian
Others
14,708
Others
0.58%
Others
Margin
853,656
Margin
33.39%
MarginSwing
14.87%
State Total
2,556,786
State Total
MA
Michigan
Michigan
Col 1
Michigan
Col 2
18
Bill ClintonDemocratic
1,989,653
Bill ClintonDemocratic
51.69%
Bill ClintonDemocratic
18
Bob DoleRepublican
1,481,212
Bob DoleRepublican
38.48%
Bob DoleRepublican
Ross PerotReform
336,670
Ross PerotReform
8.75%
Ross PerotReform
Ralph NaderGreen
2,322
Ralph NaderGreen
0.06%
Ralph NaderGreen
Harry BrowneLibertarian
27,670
Harry BrowneLibertarian
0.72%
Harry BrowneLibertarian
Others
11,317
Others
0.29%
Others
Margin
508,441
Margin
13.21%
MarginSwing
5.82%
State Total
3,848,844
State Total
MI
Minnesota
Minnesota
Col 1
Minnesota
Col 2
10
Bill ClintonDemocratic
1,120,438
Bill ClintonDemocratic
51.10%
Bill ClintonDemocratic
10
Bob DoleRepublican
766,476
Bob DoleRepublican
34.96%
Bob DoleRepublican
Ross PerotReform
257,704
Ross PerotReform
11.75%
Ross PerotReform
Ralph NaderGreen
24,908
Ralph NaderGreen
1.14%
Ralph NaderGreen
Harry BrowneLibertarian
8,271
Harry BrowneLibertarian
0.38%
Harry BrowneLibertarian
Others
14,843
Others
0.68%
Others
Margin
353,962
Margin
16.14%
MarginSwing
4.51%
State Total
2,192,640
State Total
MN
Mississippi
Mississippi
Col 1
Mississippi
Col 2
7
Bill ClintonDemocratic
394,022
Bill ClintonDemocratic
44.08%
Bill ClintonDemocratic
Bob DoleRepublican
439,838
Bob DoleRepublican
49.21%
Bob DoleRepublican
7
Ross PerotReform
52,222
Ross PerotReform
5.84%
Ross PerotReform
Ralph NaderGreen
Ralph NaderGreen
Ralph NaderGreen
Harry BrowneLibertarian
2,809
Harry BrowneLibertarian
0.31%
Harry BrowneLibertarian
Others
4,966
Others
0.56%
Others
Margin
−45,816
Margin
−5.13%
MarginSwing
3.78%
State Total
893,857
State Total
MS
Missouri
Missouri
Col 1
Missouri
Col 2
11
Bill ClintonDemocratic
1,025,935
Bill ClintonDemocratic
47.54%
Bill ClintonDemocratic
11
Bob DoleRepublican
890,016
Bob DoleRepublican
41.24%
Bob DoleRepublican
Ross PerotReform
217,188
Ross PerotReform
10.06%
Ross PerotReform
Ralph NaderGreen
534
Ralph NaderGreen
0.02%
Ralph NaderGreen
Harry BrowneLibertarian
10,522
Harry BrowneLibertarian
0.49%
Harry BrowneLibertarian
Others
13,870
Others
0.64%
Others
Margin
135,919
Margin
6.30%
MarginSwing
−3.85%
State Total
2,158,065
State Total
MO
Montana
Montana
Col 1
Montana
Col 2
3
Bill ClintonDemocratic
167,922
Bill ClintonDemocratic
41.23%
Bill ClintonDemocratic
Bob DoleRepublican
179,652
Bob DoleRepublican
44.11%
Bob DoleRepublican
3
Ross PerotReform
55,229
Ross PerotReform
13.56%
Ross PerotReform
Ralph NaderGreen
Ralph NaderGreen
Ralph NaderGreen
Harry BrowneLibertarian
2,526
Harry BrowneLibertarian
0.62%
Harry BrowneLibertarian
Others
1,932
Others
0.47%
Others
Margin
−11,730
Margin
−2.88%
MarginSwing
−5.39%
State Total
407,261
State Total
MT
Nebraska†
Nebraska†
Col 1
Nebraska†
Col 2
2
Bill ClintonDemocratic
236,761
Bill ClintonDemocratic
34.95%
Bill ClintonDemocratic
Bob DoleRepublican
363,467
Bob DoleRepublican
53.65%
Bob DoleRepublican
2
Ross PerotReform
71,278
Ross PerotReform
10.52%
Ross PerotReform
Ralph NaderGreen
Ralph NaderGreen
Ralph NaderGreen
Harry BrowneLibertarian
2,792
Harry BrowneLibertarian
0.41%
Harry BrowneLibertarian
Others
3,117
Others
0.46%
Others
Margin
−126,706
Margin
−18.70%
MarginSwing
−1.52%
State Total
677,415
State Total
NE
Nebraska-1
Nebraska-1
Col 1
Nebraska-1
Col 2
1
Bill ClintonDemocratic
87,713
Bill ClintonDemocratic
38.1%
Bill ClintonDemocratic
Bob DoleRepublican
114,560
Bob DoleRepublican
49.7%
Bob DoleRepublican
1
Ross PerotReform
25,973
Ross PerotReform
11.3%
Ross PerotReform
Ralph NaderGreen
Ralph NaderGreen
Ralph NaderGreen
Harry BrowneLibertarian
Others
2,074
Others
0.9%
Others
Margin
-28,847
Margin
-11.7%
MarginSwing
-1.10%
State Total
230,330
State Total
NE1
Nebraska-2
Nebraska-2
Col 1
Nebraska-2
Col 2
1
Bill ClintonDemocratic
84,666
Bill ClintonDemocratic
38.0%
Bill ClintonDemocratic
Bob DoleRepublican
116,892
Bob DoleRepublican
52.5%
Bob DoleRepublican
1
Ross PerotReform
18,935
Ross PerotReform
8.5%
Ross PerotReform
Ralph NaderGreen
Ralph NaderGreen
Ralph NaderGreen
Harry BrowneLibertarian
Others
2,164
Others
1.0%
Others
Margin
-32,226
Margin
-14.5%
MarginSwing
0.60%
State Total
222,660
State Total
NE2
Nebraska-3
Nebraska-3
Col 1
Nebraska-3
Col 2
1
Bill ClintonDemocratic
64,382
Bill ClintonDemocratic
28.7%
Bill ClintonDemocratic
Bob DoleRepublican
132,015
Bob DoleRepublican
58.8%
Bob DoleRepublican
1
Ross PerotReform
26,370
Ross PerotReform
11.8%
Ross PerotReform
Ralph NaderGreen
Ralph NaderGreen
Ralph NaderGreen
Harry BrowneLibertarian
Others
1,658
Others
0.7%
Others
Margin
-67,633
Margin
-30.1%
MarginSwing
-3.90%
State Total
224,425
State Total
NE3
Nevada
Nevada
Col 1
Nevada
Col 2
4
Bill ClintonDemocratic
203,974
Bill ClintonDemocratic
43.93%
Bill ClintonDemocratic
4
Bob DoleRepublican
199,244
Bob DoleRepublican
42.91%
Bob DoleRepublican
Ross PerotReform
43,986
Ross PerotReform
9.47%
Ross PerotReform
Ralph NaderGreen
4,730
Ralph NaderGreen
1.02%
Ralph NaderGreen
Harry BrowneLibertarian
4,460
Harry BrowneLibertarian
0.96%
Harry BrowneLibertarian
Others
7,885
Others
1.70%
Others
Margin
4,730
Margin
1.02%
MarginSwing
−1.61%
State Total
464,279
State Total
NV
New Hampshire
New Hampshire
Col 1
New Hampshire
Col 2
4
Bill ClintonDemocratic
246,214
Bill ClintonDemocratic
49.32%
Bill ClintonDemocratic
4
Bob DoleRepublican
196,532
Bob DoleRepublican
39.37%
Bob DoleRepublican
Ross PerotReform
48,390
Ross PerotReform
9.69%
Ross PerotReform
Ralph NaderGreen
Ralph NaderGreen
Ralph NaderGreen
Harry BrowneLibertarian
4,237
Harry BrowneLibertarian
0.85%
Harry BrowneLibertarian
Others
3,802
Others
0.76%
Others
Margin
49,682
Margin
9.95%
MarginSwing
8.73%
State Total
499,175
State Total
NH
New Jersey
New Jersey
Col 1
New Jersey
Col 2
15
Bill ClintonDemocratic
1,652,329
Bill ClintonDemocratic
53.72%
Bill ClintonDemocratic
15
Bob DoleRepublican
1,103,078
Bob DoleRepublican
35.86%
Bob DoleRepublican
Ross PerotReform
262,134
Ross PerotReform
8.52%
Ross PerotReform
Ralph NaderGreen
32,465
Ralph NaderGreen
1.06%
Ralph NaderGreen
Harry BrowneLibertarian
14,763
Harry BrowneLibertarian
0.48%
Harry BrowneLibertarian
Others
11,038
Others
0.36%
Others
Margin
549,251
Margin
17.86%
MarginSwing
15.49%
State Total
3,075,807
State Total
NJ
New Mexico
New Mexico
Col 1
New Mexico
Col 2
5
Bill ClintonDemocratic
273,495
Bill ClintonDemocratic
49.18%
Bill ClintonDemocratic
5
Bob DoleRepublican
232,751
Bob DoleRepublican
41.86%
Bob DoleRepublican
Ross PerotReform
32,257
Ross PerotReform
5.80%
Ross PerotReform
Ralph NaderGreen
13,218
Ralph NaderGreen
2.38%
Ralph NaderGreen
Harry BrowneLibertarian
2,996
Harry BrowneLibertarian
0.54%
Harry BrowneLibertarian
Others
1,357
Others
0.24%
Others
Margin
40,744
Margin
7.32%
MarginSwing
−1.24%
State Total
556,074
State Total
NM
New York
New York
Col 1
New York
Col 2
33
Bill ClintonDemocratic
3,756,177
Bill ClintonDemocratic
59.47%
Bill ClintonDemocratic
33
Bob DoleRepublican
1,933,492
Bob DoleRepublican
30.61%
Bob DoleRepublican
Ross PerotReform
503,458
Ross PerotReform
7.97%
Ross PerotReform
Ralph NaderGreen
75,956
Ralph NaderGreen
1.20%
Ralph NaderGreen
Harry BrowneLibertarian
12,220
Harry BrowneLibertarian
0.19%
Harry BrowneLibertarian
Others
34,826
Others
0.55%
Others
Margin
1,822,685
Margin
28.86%
MarginSwing
13.01%
State Total
6,316,129
State Total
NY
North Carolina
North Carolina
Col 1
North Carolina
Col 2
14
Bill ClintonDemocratic
1,107,849
Bill ClintonDemocratic
44.04%
Bill ClintonDemocratic
Bob DoleRepublican
1,225,938
Bob DoleRepublican
48.73%
Bob DoleRepublican
14
Ross PerotReform
168,059
Ross PerotReform
6.68%
Ross PerotReform
Ralph NaderGreen
2,108
Ralph NaderGreen
0.08%
Ralph NaderGreen
Harry BrowneLibertarian
8,740
Harry BrowneLibertarian
0.35%
Harry BrowneLibertarian
Others
3,113
Others
0.12%
Others
Margin
−118,089
Margin
−4.69%
MarginSwing
−3.90%
State Total
2,515,807
State Total
NC
North Dakota
North Dakota
Col 1
North Dakota
Col 2
3
Bill ClintonDemocratic
106,905
Bill ClintonDemocratic
40.13%
Bill ClintonDemocratic
Bob DoleRepublican
125,050
Bob DoleRepublican
46.94%
Bob DoleRepublican
3
Ross PerotReform
32,515
Ross PerotReform
12.20%
Ross PerotReform
Ralph NaderGreen
Ralph NaderGreen
Ralph NaderGreen
Harry BrowneLibertarian
847
Harry BrowneLibertarian
0.32%
Harry BrowneLibertarian
Others
1,094
Others
0.41%
Others
Margin
−18,145
Margin
−6.81%
MarginSwing
5.23%
State Total
266,411
State Total
ND
Ohio
Ohio
Col 1
Ohio
Col 2
21
Bill ClintonDemocratic
2,148,222
Bill ClintonDemocratic
47.38%
Bill ClintonDemocratic
21
Bob DoleRepublican
1,859,883
Bob DoleRepublican
41.02%
Bob DoleRepublican
Ross PerotReform
483,207
Ross PerotReform
10.66%
Ross PerotReform
Ralph NaderGreen
2,962
Ralph NaderGreen
0.07%
Ralph NaderGreen
Harry BrowneLibertarian
12,851
Harry BrowneLibertarian
0.28%
Harry BrowneLibertarian
Others
27,309
Others
0.60%
Others
Margin
288,339
Margin
6.36%
MarginSwing
4.53%
State Total
4,534,434
State Total
OH
Oklahoma
Oklahoma
Col 1
Oklahoma
Col 2
8
Bill ClintonDemocratic
488,105
Bill ClintonDemocratic
40.45%
Bill ClintonDemocratic
Bob DoleRepublican
582,315
Bob DoleRepublican
48.26%
Bob DoleRepublican
8
Ross PerotReform
130,788
Ross PerotReform
10.84%
Ross PerotReform
Ralph NaderGreen
Ralph NaderGreen
Ralph NaderGreen
Harry BrowneLibertarian
5,505
Harry BrowneLibertarian
0.46%
Harry BrowneLibertarian
Others
Others
Others
Margin
−94,210
Margin
−7.81%
MarginSwing
0.82%
State Total
1,206,713
State Total
OK
Oregon
Oregon
Col 1
Oregon
Col 2
7
Bill ClintonDemocratic
649,641
Bill ClintonDemocratic
47.15%
Bill ClintonDemocratic
7
Bob DoleRepublican
538,152
Bob DoleRepublican
39.06%
Bob DoleRepublican
Ross PerotReform
121,221
Ross PerotReform
8.80%
Ross PerotReform
Ralph NaderGreen
49,415
Ralph NaderGreen
3.59%
Ralph NaderGreen
Harry BrowneLibertarian
8,903
Harry BrowneLibertarian
0.65%
Harry BrowneLibertarian
Others
10,428
Others
0.76%
Others
Margin
111,489
Margin
8.09%
MarginSwing
−1.86%
State Total
1,377,760
State Total
OR
Pennsylvania
Pennsylvania
Col 1
Pennsylvania
Col 2
23
Bill ClintonDemocratic
2,215,819
Bill ClintonDemocratic
49.17%
Bill ClintonDemocratic
23
Bob DoleRepublican
1,801,169
Bob DoleRepublican
39.97%
Bob DoleRepublican
Ross PerotReform
430,984
Ross PerotReform
9.56%
Ross PerotReform
Ralph NaderGreen
3,086
Ralph NaderGreen
0.07%
Ralph NaderGreen
Harry BrowneLibertarian
28,000
Harry BrowneLibertarian
0.62%
Harry BrowneLibertarian
Others
27,060
Others
0.60%
Others
Margin
414,650
Margin
9.20%
MarginSwing
0.18%
State Total
4,506,118
State Total
PA
Rhode Island
Rhode Island
Col 1
Rhode Island
Col 2
4
Bill ClintonDemocratic
233,050
Bill ClintonDemocratic
59.71%
Bill ClintonDemocratic
4
Bob DoleRepublican
104,683
Bob DoleRepublican
26.82%
Bob DoleRepublican
Ross PerotReform
43,723
Ross PerotReform
11.20%
Ross PerotReform
Ralph NaderGreen
6,040
Ralph NaderGreen
1.55%
Ralph NaderGreen
Harry BrowneLibertarian
1,109
Harry BrowneLibertarian
0.28%
Harry BrowneLibertarian
Others
1,679
Others
0.43%
Others
Margin
128,367
Margin
32.89%
MarginSwing
14.87%
State Total
390,284
State Total
RI
South Carolina
South Carolina
Col 1
South Carolina
Col 2
8
Bill ClintonDemocratic
506,283
Bill ClintonDemocratic
43.96%
Bill ClintonDemocratic
Bob DoleRepublican
573,458
Bob DoleRepublican
49.79%
Bob DoleRepublican
8
Ross PerotReform
64,386
Ross PerotReform
5.59%
Ross PerotReform
Ralph NaderGreen
Ralph NaderGreen
Ralph NaderGreen
Harry BrowneLibertarian
4,271
Harry BrowneLibertarian
0.37%
Harry BrowneLibertarian
Others
3,291
Others
0.29%
Others
Margin
−67,175
Margin
−5.83%
MarginSwing
2.31%
State Total
1,151,689
State Total
SC
South Dakota
South Dakota
Col 1
South Dakota
Col 2
3
Bill ClintonDemocratic
139,333
Bill ClintonDemocratic
43.03%
Bill ClintonDemocratic
Bob DoleRepublican
150,543
Bob DoleRepublican
46.49%
Bob DoleRepublican
3
Ross PerotReform
31,250
Ross PerotReform
9.65%
Ross PerotReform
Ralph NaderGreen
Ralph NaderGreen
Ralph NaderGreen
Harry BrowneLibertarian
1,472
Harry BrowneLibertarian
0.45%
Harry BrowneLibertarian
Others
1,228
Others
0.38%
Others
Margin
−11,210
Margin
−3.46%
MarginSwing
0.06%
State Total
323,826
State Total
SD
Tennessee
Tennessee
Col 1
Tennessee
Col 2
11
Bill ClintonDemocratic
909,146
Bill ClintonDemocratic
48.00%
Bill ClintonDemocratic
11
Bob DoleRepublican
863,530
Bob DoleRepublican
45.59%
Bob DoleRepublican
Ross PerotReform
105,918
Ross PerotReform
5.59%
Ross PerotReform
Ralph NaderGreen
6,427
Ralph NaderGreen
0.34%
Ralph NaderGreen
Harry BrowneLibertarian
5,020
Harry BrowneLibertarian
0.27%
Harry BrowneLibertarian
Others
4,064
Others
0.21%
Others
Margin
45,616
Margin
2.41%
MarginSwing
−2.24%
State Total
1,894,105
State Total
TN
Texas
Texas
Col 1
Texas
Col 2
32
Bill ClintonDemocratic
2,459,683
Bill ClintonDemocratic
43.83%
Bill ClintonDemocratic
Bob DoleRepublican
2,736,167
Bob DoleRepublican
48.76%
Bob DoleRepublican
32
Ross PerotReform
378,537
Ross PerotReform
6.75%
Ross PerotReform
Ralph NaderGreen
4,810
Ralph NaderGreen
0.09%
Ralph NaderGreen
Harry BrowneLibertarian
20,256
Harry BrowneLibertarian
0.36%
Harry BrowneLibertarian
Others
12,191
Others
0.22%
Others
Margin
−276,484
Margin
−4.93%
MarginSwing
−1.45%
State Total
5,611,644
State Total
TX
Utah
Utah
Col 1
Utah
Col 2
5
Bill ClintonDemocratic
221,633
Bill ClintonDemocratic
33.30%
Bill ClintonDemocratic
Bob DoleRepublican
361,911
Bob DoleRepublican
54.37%
Bob DoleRepublican
5
Ross PerotReform
66,461
Ross PerotReform
9.98%
Ross PerotReform
Ralph NaderGreen
4,615
Ralph NaderGreen
0.69%
Ralph NaderGreen
Harry BrowneLibertarian
4,129
Harry BrowneLibertarian
0.62%
Harry BrowneLibertarian
Others
6,880
Others
1.03%
Others
Margin
−140,278
Margin
−21.07%
MarginSwing
−2.26%
State Total
665,629
State Total
UT
Vermont
Vermont
Col 1
Vermont
Col 2
3
Bill ClintonDemocratic
137,894
Bill ClintonDemocratic
53.35%
Bill ClintonDemocratic
3
Bob DoleRepublican
80,352
Bob DoleRepublican
31.09%
Bob DoleRepublican
Ross PerotReform
31,024
Ross PerotReform
12.00%
Ross PerotReform
Ralph NaderGreen
5,585
Ralph NaderGreen
2.16%
Ralph NaderGreen
Harry BrowneLibertarian
1,183
Harry BrowneLibertarian
0.46%
Harry BrowneLibertarian
Others
2,411
Others
0.93%
Others
Margin
57,542
Margin
22.26%
MarginSwing
6.56%
State Total
258,449
State Total
VT
Virginia
Virginia
Col 1
Virginia
Col 2
13
Bill ClintonDemocratic
1,091,060
Bill ClintonDemocratic
45.15%
Bill ClintonDemocratic
Bob DoleRepublican
1,138,350
Bob DoleRepublican
47.10%
Bob DoleRepublican
13
Ross PerotReform
159,861
Ross PerotReform
6.62%
Ross PerotReform
Ralph NaderGreen
Ralph NaderGreen
Ralph NaderGreen
Harry BrowneLibertarian
9,174
Harry BrowneLibertarian
0.38%
Harry BrowneLibertarian
Others
18,197
Others
0.75%
Others
Margin
−47,290
Margin
−1.95%
MarginSwing
2.43%
State Total
2,416,642
State Total
VA
Washington
Washington
Col 1
Washington
Col 2
11
Bill ClintonDemocratic
1,123,323
Bill ClintonDemocratic
49.84%
Bill ClintonDemocratic
11
Bob DoleRepublican
840,712
Bob DoleRepublican
37.30%
Bob DoleRepublican
Ross PerotReform
201,003
Ross PerotReform
8.92%
Ross PerotReform
Ralph NaderGreen
60,322
Ralph NaderGreen
2.68%
Ralph NaderGreen
Harry BrowneLibertarian
12,522
Harry BrowneLibertarian
0.56%
Harry BrowneLibertarian
Others
15,955
Others
0.71%
Others
Margin
282,611
Margin
12.54%
MarginSwing
1.10%
State Total
2,253,837
State Total
WA
West Virginia
West Virginia
Col 1
West Virginia
Col 2
5
Bill ClintonDemocratic
327,812
Bill ClintonDemocratic
51.51%
Bill ClintonDemocratic
5
Bob DoleRepublican
233,946
Bob DoleRepublican
36.76%
Bob DoleRepublican
Ross PerotReform
71,639
Ross PerotReform
11.26%
Ross PerotReform
Ralph NaderGreen
Ralph NaderGreen
Ralph NaderGreen
Harry BrowneLibertarian
3,062
Harry BrowneLibertarian
0.48%
Harry BrowneLibertarian
Others
Others
Others
Margin
93,866
Margin
14.75%
MarginSwing
1.73%
State Total
636,459
State Total
WV
Wisconsin
Wisconsin
Col 1
Wisconsin
Col 2
11
Bill ClintonDemocratic
1,071,971
Bill ClintonDemocratic
48.81%
Bill ClintonDemocratic
11
Bob DoleRepublican
845,029
Bob DoleRepublican
38.48%
Bob DoleRepublican
Ross PerotReform
227,339
Ross PerotReform
10.35%
Ross PerotReform
Ralph NaderGreen
28,723
Ralph NaderGreen
1.31%
Ralph NaderGreen
Harry BrowneLibertarian
7,929
Harry BrowneLibertarian
0.36%
Harry BrowneLibertarian
Others
15,178
Others
0.69%
Others
Margin
226,942
Margin
10.33%
MarginSwing
5.98%
State Total
2,196,169
State Total
WI
Wyoming
Wyoming
Col 1
Wyoming
Col 2
3
Bill ClintonDemocratic
77,934
Bill ClintonDemocratic
36.84%
Bill ClintonDemocratic
Bob DoleRepublican
105,388
Bob DoleRepublican
49.81%
Bob DoleRepublican
3
Ross PerotReform
25,928
Ross PerotReform
12.25%
Ross PerotReform
Ralph NaderGreen
Ralph NaderGreen
Ralph NaderGreen
Harry BrowneLibertarian
1,739
Harry BrowneLibertarian
0.82%
Harry BrowneLibertarian
Others
582
Others
0.28%
Others
Margin
−27,454
Margin
−12.97%
MarginSwing
−7.39%
State Total
211,571
State Total
WY
TOTALS:
TOTALS:
Col 1
TOTALS:
Col 2
538
Bill ClintonDemocratic
47,402,357
Bill ClintonDemocratic
49.24%
Bill ClintonDemocratic
379
Bob DoleRepublican
39,198,755
Bob DoleRepublican
40.71%
Bob DoleRepublican
159
Ross PerotReform
8,085,402
Ross PerotReform
8.40%
Ross PerotReform
Ralph NaderGreen
684,902
Ralph NaderGreen
0.71%
Ralph NaderGreen
Harry BrowneLibertarian
485,798
Harry BrowneLibertarian
0.50%
Harry BrowneLibertarian
Others
420,009
Others
0.44%
Others
Margin
8,203,602
Margin
8.52%
MarginSwing
2.96%
State Total
96,277,223
State Total
US
Bill ClintonDemocratic
Bob DoleRepublican
Ross PerotReform
Ralph NaderGreen
Harry BrowneLibertarian
Others
Margin
MarginSwing
State Total
State
elec­toralvotes
#
%
elec­toralvotes
#
%
elec­toralvotes
#
%
elec­toralvotes
#
%
elec­toralvotes
#
%
elec­toralvotes
#
%
elec­toralvotes
#
%
%
#
Alabama
9
662,165
43.16%
769,044
50.12%
9
92,149
6.01%
5,290
0.34%
5,701
0.37%
−106,879
−6.96%
−0.19%
1,534,349
AL
Alaska
3
80,380
33.27%
122,746
50.80%
3
26,333
10.90%
7,597
3.14%
2,276
0.94%
2,288
0.95%
−42,366
−17.53%
−8.36%
241,620
AK
Arizona
8
653,288
46.52%
8
622,073
44.29%
112,072
7.98%
2,062
0.15%
14,358
1.02%
552
0.04%
31,215
2.23%
4.18%
1,404,405
AZ
Arkansas
6
475,171
53.74%
6
325,416
36.80%
69,884
7.90%
3,649
0.41%
3,076
0.35%
7,066
0.80%
149,755
16.94%
−0.79%
884,262
AR
California
54
5,119,835
51.10%
54
3,828,380
38.21%
697,847
6.96%
237,016
2.37%
73,600
0.73%
62,806
0.63%
1,291,455
12.89%
−0.51%
10,019,484
CA
Colorado
8
671,152
44.43%
691,848
45.80%
8
99,629
6.59%
25,070
1.66%
12,392
0.82%
10,613
0.70%
−20,696
−1.37%
−5.63%
1,510,704
CO
Connecticut
8
735,740
52.83%
8
483,109
34.69%
139,523
10.02%
24,321
1.75%
5,788
0.42%
4,133
0.30%
252,631
18.14%
11.71%
1,392,614
CT
Delaware
3
140,355
51.80%
3
99,062
36.58%
28,719
10.60%
18
0.01%
2,052
0.76%
639
0.24%
41,293
15.22%
7.03%
270,845
DE
D.C.
3
158,220
85.19%
3
17,339
9.34%
3,611
1.94%
4,780
2.57%
588
0.32%
1,188
0.64%
140,881
75.85%
0.23%
185,726
DC
Florida
25
2,546,870
48.02%
25
2,244,536
42.32%
483,870
9.12%
4,101
0.08%
23,965
0.45%
452
0.01%
302,334
5.70%
7.59%
5,303,794
FL
Georgia
13
1,053,849
45.84%
1,080,843
47.01%
13
146,337
6.37%
17,870
0.78%
172
0.01%
−26,994
−1.17%
−1.76%
2,299,071
GA
Hawaii
4
205,012
56.93%
4
113,943
31.64%
27,358
7.60%
10,386
2.88%
2,493
0.69%
928
0.26%
91,069
25.29%
13.90%
360,120
HI
Idaho
4
165,443
33.65%
256,595
52.18%
4
62,518
12.71%
3,325
0.68%
3,838
0.78%
−91,152
−18.53%
−4.92%
491,719
ID
Illinois
22
2,341,744
54.32%
22
1,587,021
36.81%
346,408
8.03%
1,447
0.03%
22,548
0.52%
12,223
0.29%
754,723
17.51%
3.27%
4,311,391
IL
Indiana
12
887,424
41.55%
1,006,693
47.13%
12
224,299
10.50%
1,121
0.05%
15,632
0.73%
673
0.03%
−119,269
−5.58%
0.54%
2,135,842
IN
Iowa
7
620,258
50.26%
7
492,644
39.92%
105,159
8.52%
6,550
0.53%
2,315
0.19%
7,149
0.58%
127,614
10.34%
4.32%
1,234,075
IA
Kansas
6
387,659
36.08%
583,245
54.29%
6
92,639
8.62%
914
0.09%
4,557
0.42%
5,286
0.49%
−195,586
−18.21%
−13.07%
1,074,300
KS
Kentucky
8
636,614
45.84%
8
623,283
44.88%
120,396
8.67%
701
0.05%
4,009
0.29%
3,705
0.27%
13,331
0.96%
−2.25%
1,388,708
KY
Louisiana
9
927,837
52.01%
9
712,586
39.94%
123,293
6.91%
4,719
0.26%
7,499
0.42%
8,025
0.45%
215,251
12.07%
7.46%
1,783,959
LA
Maine†
2
312,788
51.62%
2
186,378
30.76%
85,970
14.19%
15,279
2.52%
2,996
0.49%
2,486
0.41%
126,410
20.86%
12.48%
605,897
ME
Maine-1
1
165,053
52.1%
1
100,851
31.8%
39,845
12.6%
11,372
3.6%
64,202
20.3%
12.19%
317,121
ME1
Maine-2
1
147,735
51.2%
1
85,527
29.6%
46,125
16.0%
9,389
3.3%
62,208
21.5%
12.70%
288,776
ME2
Maryland
10
966,207
54.25%
10
681,530
38.27%
115,812
6.50%
2,606
0.15%
8,765
0.49%
5,950
0.33%
284,677
15.98%
1.80%
1,780,870
MD
Massachusetts
12
1,571,763
61.47%
12
718,107
28.08%
227,217
8.89%
4,565
0.18%
20,426
0.80%
14,708
0.58%
853,656
33.39%
14.87%
2,556,786
MA
Michigan
18
1,989,653
51.69%
18
1,481,212
38.48%
336,670
8.75%
2,322
0.06%
27,670
0.72%
11,317
0.29%
508,441
13.21%
5.82%
3,848,844
MI
Minnesota
10
1,120,438
51.10%
10
766,476
34.96%
257,704
11.75%
24,908
1.14%
8,271
0.38%
14,843
0.68%
353,962
16.14%
4.51%
2,192,640
MN
Mississippi
7
394,022
44.08%
439,838
49.21%
7
52,222
5.84%
2,809
0.31%
4,966
0.56%
−45,816
−5.13%
3.78%
893,857
MS
Missouri
11
1,025,935
47.54%
11
890,016
41.24%
217,188
10.06%
534
0.02%
10,522
0.49%
13,870
0.64%
135,919
6.30%
−3.85%
2,158,065
MO
Montana
3
167,922
41.23%
179,652
44.11%
3
55,229
13.56%
2,526
0.62%
1,932
0.47%
−11,730
−2.88%
−5.39%
407,261
MT
Nebraska†
2
236,761
34.95%
363,467
53.65%
2
71,278
10.52%
2,792
0.41%
3,117
0.46%
−126,706
−18.70%
−1.52%
677,415
NE
Nebraska-1
1
87,713
38.1%
114,560
49.7%
1
25,973
11.3%
2,074
0.9%
-28,847
-11.7%
-1.10%
230,330
NE1
Nebraska-2
1
84,666
38.0%
116,892
52.5%
1
18,935
8.5%
2,164
1.0%
-32,226
-14.5%
0.60%
222,660
NE2
Nebraska-3
1
64,382
28.7%
132,015
58.8%
1
26,370
11.8%
1,658
0.7%
-67,633
-30.1%
-3.90%
224,425
NE3
Nevada
4
203,974
43.93%
4
199,244
42.91%
43,986
9.47%
4,730
1.02%
4,460
0.96%
7,885
1.70%
4,730
1.02%
−1.61%
464,279
NV
New Hampshire
4
246,214
49.32%
4
196,532
39.37%
48,390
9.69%
4,237
0.85%
3,802
0.76%
49,682
9.95%
8.73%
499,175
NH
New Jersey
15
1,652,329
53.72%
15
1,103,078
35.86%
262,134
8.52%
32,465
1.06%
14,763
0.48%
11,038
0.36%
549,251
17.86%
15.49%
3,075,807
NJ
New Mexico
5
273,495
49.18%
5
232,751
41.86%
32,257
5.80%
13,218
2.38%
2,996
0.54%
1,357
0.24%
40,744
7.32%
−1.24%
556,074
NM
New York
33
3,756,177
59.47%
33
1,933,492
30.61%
503,458
7.97%
75,956
1.20%
12,220
0.19%
34,826
0.55%
1,822,685
28.86%
13.01%
6,316,129
NY
North Carolina
14
1,107,849
44.04%
1,225,938
48.73%
14
168,059
6.68%
2,108
0.08%
8,740
0.35%
3,113
0.12%
−118,089
−4.69%
−3.90%
2,515,807
NC
North Dakota
3
106,905
40.13%
125,050
46.94%
3
32,515
12.20%
847
0.32%
1,094
0.41%
−18,145
−6.81%
5.23%
266,411
ND
Ohio
21
2,148,222
47.38%
21
1,859,883
41.02%
483,207
10.66%
2,962
0.07%
12,851
0.28%
27,309
0.60%
288,339
6.36%
4.53%
4,534,434
OH
Oklahoma
8
488,105
40.45%
582,315
48.26%
8
130,788
10.84%
5,505
0.46%
−94,210
−7.81%
0.82%
1,206,713
OK
Oregon
7
649,641
47.15%
7
538,152
39.06%
121,221
8.80%
49,415
3.59%
8,903
0.65%
10,428
0.76%
111,489
8.09%
−1.86%
1,377,760
OR
Pennsylvania
23
2,215,819
49.17%
23
1,801,169
39.97%
430,984
9.56%
3,086
0.07%
28,000
0.62%
27,060
0.60%
414,650
9.20%
0.18%
4,506,118
PA
Rhode Island
4
233,050
59.71%
4
104,683
26.82%
43,723
11.20%
6,040
1.55%
1,109
0.28%
1,679
0.43%
128,367
32.89%
14.87%
390,284
RI
South Carolina
8
506,283
43.96%
573,458
49.79%
8
64,386
5.59%
4,271
0.37%
3,291
0.29%
−67,175
−5.83%
2.31%
1,151,689
SC
South Dakota
3
139,333
43.03%
150,543
46.49%
3
31,250
9.65%
1,472
0.45%
1,228
0.38%
−11,210
−3.46%
0.06%
323,826
SD
Tennessee
11
909,146
48.00%
11
863,530
45.59%
105,918
5.59%
6,427
0.34%
5,020
0.27%
4,064
0.21%
45,616
2.41%
−2.24%
1,894,105
TN
· Voter demographics
Social group
Social group
The presidential vote in social groups (percentages)
Social group
The presidential vote in social groups (percentages)
Clinton
The presidential vote in social groups (percentages)
Dole
The presidential vote in social groups (percentages)
Perot
The presidential vote in social groups (percentages)
Others
The presidential vote in social groups (percentages)
% oftotal vote
Total vote
Total vote
The presidential vote in social groups (percentages)
Total vote
The presidential vote in social groups (percentages)
49
The presidential vote in social groups (percentages)
41
The presidential vote in social groups (percentages)
8
The presidential vote in social groups (percentages)
2
The presidential vote in social groups (percentages)
100
Party and ideology
Party and ideology
The presidential vote in social groups (percentages)
Party and ideology
Conservative Republicans
The presidential vote in social groups (percentages)
Conservative Republicans
The presidential vote in social groups (percentages)
6
The presidential vote in social groups (percentages)
88
The presidential vote in social groups (percentages)
5
The presidential vote in social groups (percentages)
1
The presidential vote in social groups (percentages)
21
Moderate Republicans
The presidential vote in social groups (percentages)
Moderate Republicans
The presidential vote in social groups (percentages)
20
The presidential vote in social groups (percentages)
72
The presidential vote in social groups (percentages)
7
The presidential vote in social groups (percentages)
1
The presidential vote in social groups (percentages)
13
Liberal Republicans
Liberal Republicans
The presidential vote in social groups (percentages)
Liberal Republicans
The presidential vote in social groups (percentages)
44
The presidential vote in social groups (percentages)
46
The presidential vote in social groups (percentages)
9
The presidential vote in social groups (percentages)
1
The presidential vote in social groups (percentages)
2
Conservative independents
The presidential vote in social groups (percentages)
Conservative independents
The presidential vote in social groups (percentages)
19
The presidential vote in social groups (percentages)
60
The presidential vote in social groups (percentages)
19
The presidential vote in social groups (percentages)
2
The presidential vote in social groups (percentages)
7
Moderate independents
The presidential vote in social groups (percentages)
Moderate independents
The presidential vote in social groups (percentages)
50
The presidential vote in social groups (percentages)
30
The presidential vote in social groups (percentages)
17
The presidential vote in social groups (percentages)
3
The presidential vote in social groups (percentages)
15
Liberal independents
The presidential vote in social groups (percentages)
Liberal independents
The presidential vote in social groups (percentages)
58
The presidential vote in social groups (percentages)
15
The presidential vote in social groups (percentages)
18
The presidential vote in social groups (percentages)
9
The presidential vote in social groups (percentages)
4
Conservative Democrats
The presidential vote in social groups (percentages)
Conservative Democrats
The presidential vote in social groups (percentages)
69
The presidential vote in social groups (percentages)
23
The presidential vote in social groups (percentages)
7
The presidential vote in social groups (percentages)
1
The presidential vote in social groups (percentages)
6
Moderate Democrats
Moderate Democrats
The presidential vote in social groups (percentages)
Moderate Democrats
The presidential vote in social groups (percentages)
84
The presidential vote in social groups (percentages)
10
The presidential vote in social groups (percentages)
5
The presidential vote in social groups (percentages)
1
The presidential vote in social groups (percentages)
20
Liberal Democrats
Liberal Democrats
The presidential vote in social groups (percentages)
Liberal Democrats
The presidential vote in social groups (percentages)
89
The presidential vote in social groups (percentages)
5
The presidential vote in social groups (percentages)
4
The presidential vote in social groups (percentages)
2
The presidential vote in social groups (percentages)
13
Gender and marital status
The presidential vote in social groups (percentages)
Gender and marital status
Married men
Married men
The presidential vote in social groups (percentages)
Married men
The presidential vote in social groups (percentages)
40
The presidential vote in social groups (percentages)
48
The presidential vote in social groups (percentages)
10
The presidential vote in social groups (percentages)
2
The presidential vote in social groups (percentages)
32
Married women
Married women
The presidential vote in social groups (percentages)
Married women
The presidential vote in social groups (percentages)
48
The presidential vote in social groups (percentages)
43
The presidential vote in social groups (percentages)
7
The presidential vote in social groups (percentages)
2
The presidential vote in social groups (percentages)
33
Unmarried men
Unmarried men
The presidential vote in social groups (percentages)
Unmarried men
The presidential vote in social groups (percentages)
49
The presidential vote in social groups (percentages)
36
The presidential vote in social groups (percentages)
12
The presidential vote in social groups (percentages)
3
The presidential vote in social groups (percentages)
15
Unmarried women
Unmarried women
The presidential vote in social groups (percentages)
Unmarried women
The presidential vote in social groups (percentages)
62
The presidential vote in social groups (percentages)
28
The presidential vote in social groups (percentages)
7
The presidential vote in social groups (percentages)
3
The presidential vote in social groups (percentages)
20
Race
Race
The presidential vote in social groups (percentages)
Race
White
White
The presidential vote in social groups (percentages)
White
The presidential vote in social groups (percentages)
43
The presidential vote in social groups (percentages)
46
The presidential vote in social groups (percentages)
9
The presidential vote in social groups (percentages)
2
The presidential vote in social groups (percentages)
83
Black
Black
The presidential vote in social groups (percentages)
Black
The presidential vote in social groups (percentages)
84
The presidential vote in social groups (percentages)
11
The presidential vote in social groups (percentages)
4
The presidential vote in social groups (percentages)
1
The presidential vote in social groups (percentages)
10
Hispanic
Hispanic
The presidential vote in social groups (percentages)
Hispanic
The presidential vote in social groups (percentages)
72
The presidential vote in social groups (percentages)
21
The presidential vote in social groups (percentages)
6
The presidential vote in social groups (percentages)
1
The presidential vote in social groups (percentages)
5
Asian
Asian
The presidential vote in social groups (percentages)
Asian
The presidential vote in social groups (percentages)
43
The presidential vote in social groups (percentages)
48
The presidential vote in social groups (percentages)
8
The presidential vote in social groups (percentages)
1
The presidential vote in social groups (percentages)
1
Religion
Religion
The presidential vote in social groups (percentages)
Religion
Protestant
Protestant
The presidential vote in social groups (percentages)
Protestant
The presidential vote in social groups (percentages)
41
The presidential vote in social groups (percentages)
50
The presidential vote in social groups (percentages)
8
The presidential vote in social groups (percentages)
1
The presidential vote in social groups (percentages)
38
Catholic
Catholic
The presidential vote in social groups (percentages)
Catholic
The presidential vote in social groups (percentages)
53
The presidential vote in social groups (percentages)
37
The presidential vote in social groups (percentages)
9
The presidential vote in social groups (percentages)
1
The presidential vote in social groups (percentages)
29
Other Christian
Other Christian
The presidential vote in social groups (percentages)
Other Christian
The presidential vote in social groups (percentages)
45
The presidential vote in social groups (percentages)
41
The presidential vote in social groups (percentages)
12
The presidential vote in social groups (percentages)
2
The presidential vote in social groups (percentages)
16
Jewish
Jewish
The presidential vote in social groups (percentages)
Jewish
The presidential vote in social groups (percentages)
78
The presidential vote in social groups (percentages)
16
The presidential vote in social groups (percentages)
3
The presidential vote in social groups (percentages)
3
The presidential vote in social groups (percentages)
3
Other
Other
The presidential vote in social groups (percentages)
Other
The presidential vote in social groups (percentages)
60
The presidential vote in social groups (percentages)
23
The presidential vote in social groups (percentages)
11
The presidential vote in social groups (percentages)
6
The presidential vote in social groups (percentages)
6
None
None
The presidential vote in social groups (percentages)
None
The presidential vote in social groups (percentages)
59
The presidential vote in social groups (percentages)
23
The presidential vote in social groups (percentages)
13
The presidential vote in social groups (percentages)
5
The presidential vote in social groups (percentages)
7
White Religious Right
The presidential vote in social groups (percentages)
White Religious Right
The presidential vote in social groups (percentages)
White Religious Right
The presidential vote in social groups (percentages)
26
The presidential vote in social groups (percentages)
65
The presidential vote in social groups (percentages)
8
The presidential vote in social groups (percentages)
1
The presidential vote in social groups (percentages)
17
Everyone else
Everyone else
The presidential vote in social groups (percentages)
Everyone else
The presidential vote in social groups (percentages)
54
The presidential vote in social groups (percentages)
35
The presidential vote in social groups (percentages)
9
The presidential vote in social groups (percentages)
2
The presidential vote in social groups (percentages)
83
Age
Age
The presidential vote in social groups (percentages)
Age
18–29 years old
18–29 years old
The presidential vote in social groups (percentages)
18–29 years old
The presidential vote in social groups (percentages)
53
The presidential vote in social groups (percentages)
34
The presidential vote in social groups (percentages)
10
The presidential vote in social groups (percentages)
3
The presidential vote in social groups (percentages)
16
30–44 years old
30–44 years old
The presidential vote in social groups (percentages)
30–44 years old
The presidential vote in social groups (percentages)
48
The presidential vote in social groups (percentages)
41
The presidential vote in social groups (percentages)
9
The presidential vote in social groups (percentages)
2
The presidential vote in social groups (percentages)
33
45–59 years old
45–59 years old
The presidential vote in social groups (percentages)
45–59 years old
The presidential vote in social groups (percentages)
48
The presidential vote in social groups (percentages)
41
The presidential vote in social groups (percentages)
9
The presidential vote in social groups (percentages)
2
The presidential vote in social groups (percentages)
26
60 and older
60 and older
The presidential vote in social groups (percentages)
60 and older
The presidential vote in social groups (percentages)
48
The presidential vote in social groups (percentages)
44
The presidential vote in social groups (percentages)
7
The presidential vote in social groups (percentages)
1
The presidential vote in social groups (percentages)
25
First time voters
First time voters
The presidential vote in social groups (percentages)
First time voters
First time voter
First time voter
The presidential vote in social groups (percentages)
First time voter
The presidential vote in social groups (percentages)
54
The presidential vote in social groups (percentages)
34
The presidential vote in social groups (percentages)
11
The presidential vote in social groups (percentages)
1
The presidential vote in social groups (percentages)
9
Everyone else
Everyone else
The presidential vote in social groups (percentages)
Everyone else
The presidential vote in social groups (percentages)
48
The presidential vote in social groups (percentages)
42
The presidential vote in social groups (percentages)
8
The presidential vote in social groups (percentages)
2
The presidential vote in social groups (percentages)
91
Sexual orientation
Sexual orientation
The presidential vote in social groups (percentages)
Sexual orientation
Gay, lesbian, or bisexual
The presidential vote in social groups (percentages)
Gay, lesbian, or bisexual
The presidential vote in social groups (percentages)
66
The presidential vote in social groups (percentages)
23
The presidential vote in social groups (percentages)
7
The presidential vote in social groups (percentages)
4
The presidential vote in social groups (percentages)
5
Heterosexual
Heterosexual
The presidential vote in social groups (percentages)
Heterosexual
The presidential vote in social groups (percentages)
47
The presidential vote in social groups (percentages)
43
The presidential vote in social groups (percentages)
8
The presidential vote in social groups (percentages)
2
The presidential vote in social groups (percentages)
95
Education
Education
The presidential vote in social groups (percentages)
Education
Not a high school graduate
The presidential vote in social groups (percentages)
Not a high school graduate
The presidential vote in social groups (percentages)
59
The presidential vote in social groups (percentages)
28
The presidential vote in social groups (percentages)
11
The presidential vote in social groups (percentages)
2
The presidential vote in social groups (percentages)
6
High school graduate
The presidential vote in social groups (percentages)
High school graduate
The presidential vote in social groups (percentages)
51
The presidential vote in social groups (percentages)
35
The presidential vote in social groups (percentages)
13
The presidential vote in social groups (percentages)
1
The presidential vote in social groups (percentages)
24
Some college education
The presidential vote in social groups (percentages)
Some college education
The presidential vote in social groups (percentages)
48
The presidential vote in social groups (percentages)
40
The presidential vote in social groups (percentages)
10
The presidential vote in social groups (percentages)
2
The presidential vote in social groups (percentages)
27
College graduate
College graduate
The presidential vote in social groups (percentages)
College graduate
The presidential vote in social groups (percentages)
44
The presidential vote in social groups (percentages)
46
The presidential vote in social groups (percentages)
8
The presidential vote in social groups (percentages)
2
The presidential vote in social groups (percentages)
26
Postgraduate education
The presidential vote in social groups (percentages)
Postgraduate education
The presidential vote in social groups (percentages)
52
The presidential vote in social groups (percentages)
40
The presidential vote in social groups (percentages)
5
The presidential vote in social groups (percentages)
3
The presidential vote in social groups (percentages)
17
Family income
Family income
The presidential vote in social groups (percentages)
Family income
Under $15,000
Under $15,000
The presidential vote in social groups (percentages)
Under $15,000
The presidential vote in social groups (percentages)
59
The presidential vote in social groups (percentages)
28
The presidential vote in social groups (percentages)
11
The presidential vote in social groups (percentages)
2
The presidential vote in social groups (percentages)
11
$15,000–30,000
$15,000–30,000
The presidential vote in social groups (percentages)
$15,000–30,000
The presidential vote in social groups (percentages)
51
The presidential vote in social groups (percentages)
38
The presidential vote in social groups (percentages)
9
The presidential vote in social groups (percentages)
2
The presidential vote in social groups (percentages)
23
$30,000–50,000
$30,000–50,000
The presidential vote in social groups (percentages)
$30,000–50,000
The presidential vote in social groups (percentages)
48
The presidential vote in social groups (percentages)
40
The presidential vote in social groups (percentages)
10
The presidential vote in social groups (percentages)
2
The presidential vote in social groups (percentages)
27
$50,000–75,000
$50,000–75,000
The presidential vote in social groups (percentages)
$50,000–75,000
The presidential vote in social groups (percentages)
47
The presidential vote in social groups (percentages)
45
The presidential vote in social groups (percentages)
7
The presidential vote in social groups (percentages)
1
The presidential vote in social groups (percentages)
21
$75,000–100,000
$75,000–100,000
The presidential vote in social groups (percentages)
$75,000–100,000
The presidential vote in social groups (percentages)
44
The presidential vote in social groups (percentages)
48
The presidential vote in social groups (percentages)
7
The presidential vote in social groups (percentages)
1
The presidential vote in social groups (percentages)
9
Over $100,000
Over $100,000
The presidential vote in social groups (percentages)
Over $100,000
The presidential vote in social groups (percentages)
38
The presidential vote in social groups (percentages)
54
The presidential vote in social groups (percentages)
6
The presidential vote in social groups (percentages)
2
The presidential vote in social groups (percentages)
9
Region
Region
The presidential vote in social groups (percentages)
Region
East
East
The presidential vote in social groups (percentages)
East
The presidential vote in social groups (percentages)
55
The presidential vote in social groups (percentages)
34
The presidential vote in social groups (percentages)
9
The presidential vote in social groups (percentages)
2
The presidential vote in social groups (percentages)
23
Midwest
Midwest
The presidential vote in social groups (percentages)
Midwest
The presidential vote in social groups (percentages)
48
The presidential vote in social groups (percentages)
41
The presidential vote in social groups (percentages)
10
The presidential vote in social groups (percentages)
1
The presidential vote in social groups (percentages)
26
South
South
The presidential vote in social groups (percentages)
South
The presidential vote in social groups (percentages)
46
The presidential vote in social groups (percentages)
46
The presidential vote in social groups (percentages)
7
The presidential vote in social groups (percentages)
1
The presidential vote in social groups (percentages)
30
West
West
The presidential vote in social groups (percentages)
West
The presidential vote in social groups (percentages)
48
The presidential vote in social groups (percentages)
40
The presidential vote in social groups (percentages)
8
The presidential vote in social groups (percentages)
4
The presidential vote in social groups (percentages)
20
Community size
Community size
The presidential vote in social groups (percentages)
Community size
Population over 500,000
The presidential vote in social groups (percentages)
Population over 500,000
The presidential vote in social groups (percentages)
68
The presidential vote in social groups (percentages)
25
The presidential vote in social groups (percentages)
5
The presidential vote in social groups (percentages)
2
The presidential vote in social groups (percentages)
10
Population 50,000 to 500,000
The presidential vote in social groups (percentages)
Population 50,000 to 500,000
The presidential vote in social groups (percentages)
50
The presidential vote in social groups (percentages)
39
The presidential vote in social groups (percentages)
8
The presidential vote in social groups (percentages)
3
The presidential vote in social groups (percentages)
21
Suburbs
Suburbs
The presidential vote in social groups (percentages)
Suburbs
The presidential vote in social groups (percentages)
47
The presidential vote in social groups (percentages)
42
The presidential vote in social groups (percentages)
8
The presidential vote in social groups (percentages)
3
The presidential vote in social groups (percentages)
39
Rural areas, towns
Rural areas, towns
The presidential vote in social groups (percentages)
Rural areas, towns
The presidential vote in social groups (percentages)
45
The presidential vote in social groups (percentages)
44
The presidential vote in social groups (percentages)
10
The presidential vote in social groups (percentages)
1
The presidential vote in social groups (percentages)
30
The presidential vote in social groups (percentages)
Social group
Clinton
Dole
Perot
Others
% oftotal vote
Total vote
49
41
8
2
100
Party and ideology
Conservative Republicans
6
88
5
1
21
Moderate Republicans
20
72
7
1
13
Liberal Republicans
44
46
9
1
2
Conservative independents
19
60
19
2
7
Moderate independents
50
30
17
3
15
Liberal independents
58
15
18
9
4
Conservative Democrats
69
23
7
1
6
Moderate Democrats
84
10
5
1
20
Liberal Democrats
89
5
4
2
13
Gender and marital status
Married men
40
48
10
2
32
Married women
48
43
7
2
33
Unmarried men
49
36
12
3
15
Unmarried women
62
28
7
3
20
Race
White
43
46
9
2
83
Black
84
11
4
1
10
Hispanic
72
21
6
1
5
Asian
43
48
8
1
1
Religion
Protestant
41
50
8
1
38
Catholic
53
37
9
1
29
Other Christian
45
41
12
2
16
Jewish
78
16
3
3
3
Other
60
23
11
6
6
None
59
23
13
5
7
White Religious Right
26
65
8
1
17
Everyone else
54
35
9
2
83
Age
18–29 years old
53
34
10
3
16
30–44 years old
48
41
9
2
33
45–59 years old
48
41
9
2
26
60 and older
48
44
7
1
25
First time voters
First time voter
54
34
11
1
9
Everyone else
48
42
8
2
91
Sexual orientation
Gay, lesbian, or bisexual
66
23
7
4
5
Heterosexual
47
43
8
2
95
Education
Not a high school graduate
59
28
11
2
6
High school graduate
51
35
13
1
24
Some college education
48
40
10
2
27
College graduate
44
46
8
2
26
Postgraduate education
52
40
5
3
17

References

  1. On the California, Indiana, Iowa, Kansas, Louisiana, Maine, Maryland, Missouri, Montana, Oregon, South Dakota, Tennessee
  2. In New York, the Clinton vote was a fusion of the Democratic and Liberal slates. There, Clinton obtained 3,649,630 votes
  3. In New York, the Dole vote was a fusion of the Republican, Conservative, and Freedom slates. There, Dole obtained 1,738,
  4. In South Carolina, the Perot vote was a fusion of the Reform and Patriot slates. There, Perot obtained 27,464 votes on t
  5. On the California, Indiana, Iowa, Kansas, Louisiana, Maine, Maryland, Missouri, Montana, Oregon, South Dakota, Tennessee
  6. The Green Party vice presidential candidate varied from state to state. Winona LaDuke was his vice presidential candidat
  7. Candidates receiving less than 0.05% of the total popular vote.
  8. Percentage point difference in margin from the 1992 election
  9. United States Election Project
    http://www.electproject.org/national-1789-present
  10. "FEDERAL ELECTIONS 96 Election Results for the U.S. President, the U.S. Senate and the U.S. House of Representatives"
    https://www.fec.gov/resources/cms-content/documents/federalelections96.pdf
  11. The Washington Post
    https://www.washingtonpost.com/archive/politics/1996/08/16/dole-vows-brighter-economy-stresses-values/90e95a90-4eed-4174-9119-0e957dcf8922/
  12. The Progressive
    http://www.thefreelibrary.com/Anyone+left%3F+The+search+for+a+Clinton+challenger+in+1996.-a016914424
  13. Time
    https://web.archive.org/web/20091127054042/http://www.time.com/time/politics/article/0,8599,1942614,00.html
  14. Guide to U.S. Elections
  15. Guide to U.S. Elections
  16. C-SPAN.org
    https://www.c-span.org/video/?63441-1/new-hampshire-republican-forum
  17. "Republicans Prepare to Run in 1996 – Arab American Institute"
    https://web.archive.org/web/20171001074512/http://www.aaiusa.org/w060694
  18. Los Angeles Times
    https://www.latimes.com/archives/la-xpm-1995-01-04-mn-16258-story.html
  19. Julie Hirschfeld Davis (January 26, 2012), "'Stop-Newt' Republicans Confront New Base" Archived December 2, 2013, at the
    https://www.bloomberg.com/news/2012-01-26/-stop-newt-republicans-confront-base-unwilling-to-take-orders.html
  20. Guide to U.S. Elections
  21. Chicago Tribune
    https://www.chicagotribune.com/1996/09/20/dole-makes-strong-rebound-after-fall/
  22. Townhall.com
    http://townhall.com/columnists/mattlewis/2008/09/25/mccain_and_obama_can_learn_a_lot_from_past_debaters
  23. The New York Times
    https://query.nytimes.com/gst/fullpage.html?res=9507E2DC1F3FF934A35753C1A960958260
  24. "09/02/96 Medicare, Taxes, and Bob Dole: A Talk with the President"
    https://web.archive.org/web/19970628211536/http://www.businessweek.com/1996/36/b34915.htm
  25. The Wall Street Journal
    https://www.wsj.com/articles/an-oral-history-of-the-first-presidential-campaign-websites-in-1996-1455831487
  26. The New York Times
    https://www.nytimes.com/1996/10/23/us/gop-pushes-congress-strategy-that-shuns-dole.html
  27. Yahoo! News
    https://www.yahoo.com/news/down-ticket-3-republicans-want-to-keep-congress-by-sacrificing-trump-good-luck-with-that-173040834.html
  28. www.debates.org
    https://www.debates.org/index.php?page=1996-debates
  29. The Washington Post
    https://www.washingtonpost.com/wp-srv/politics/special/campfin/stories/china1.htm
  30. CNN
    https://web.archive.org/web/20130403040001/http://transcripts.cnn.com/2000/ALLPOLITICS/stories/03/03/gore3_3.a.tm/index.html
  31. The Washington Post
    https://www.washingtonpost.com/wp-srv/politics/special/campfin/stories/fifth060998.htm
  32. Dave Leip's Atlas of U.S. Presidential Elections
    https://uselectionatlas.org/RESULTS/index.html
  33. "Clinton takes Arizona, nation"
    https://wc.arizona.edu/papers/90/55/01_1_m.html
  34. The New York Times
    https://query.nytimes.com/gst/fullpage.html?res=9E0CE0DB1F3FF936A35752C1A964958260
  35. "AllPolitics – Presidential Election Exit Poll Results"
    http://www.cnn.com/ALLPOLITICS/1996/elections/natl.exit.poll/index1.html
  36. "AllPolitics – Tracking Poll"
    http://www.cnn.com/ALLPOLITICS/1996/polls/cnn.usa.gallup/tracking/
  37. Sullivan, Robert David; 'How the Red and Blue Map Evolved Over the Past Century' Archived November 16, 2016, at the Wayb
    http://www.americamagazine.org/content/unconventional-wisdom/how-red-and-blue-map-evolved-over-past-century
  38. www.presidency.ucsb.edu
    https://www.presidency.ucsb.edu/statistics/data/voter-turnout-in-presidential-elections
  39. Official website of the Office of the Clerk of the House of Representatives
    https://web.archive.org/web/20060126213548/http://clerk.house.gov/members/electionInfo/1996/96Stat.htm
  40. The Washington Post
    https://www.washingtonpost.com/blogs/wonkblog/wp/2012/08/09/the-effect-of-veep-picks-in-two-charts/
  41. Minutes of the Meetings of the Board of Supervisors
    https://web.archive.org/web/20060526215035/http://www.co.cerro-gordo.ia.us/1996Minutes/November%2012,%201996.pdf
  42. The Daily Princetonian
    https://web.archive.org/web/20070324210947/http://www.dailyprincetonian.com/archives/2000/02/22/news/234.shtml
  43. Cattaraugus County: Board of Elections: 1996 Election Results
    https://web.archive.org/web/20070928123601/http://www.co.cattaraugus.ny.us/election_board/past-elections/1996/presandvp.html
  44. 1996 Presidential General Election Data - National Archived July 9, 2019, at the Wayback Machine, Uselectionatlas.org.
    http://uselectionatlas.org/RESULTS/data.php?year=1996&datatype=national&def=1&f=0&off=0&elect=0
  45. The Political Reference Almanac, 1999–2000
  46. The New York Times
    https://www.nytimes.com/1996/11/10/us/portrait-of-the-electorate.html
  47. The Public Opinion Quarterly
    https://doi.org/10.1086%2F297842
Image
Source:
Tip: Wheel or +/− to zoom, drag to pan, Esc to close.